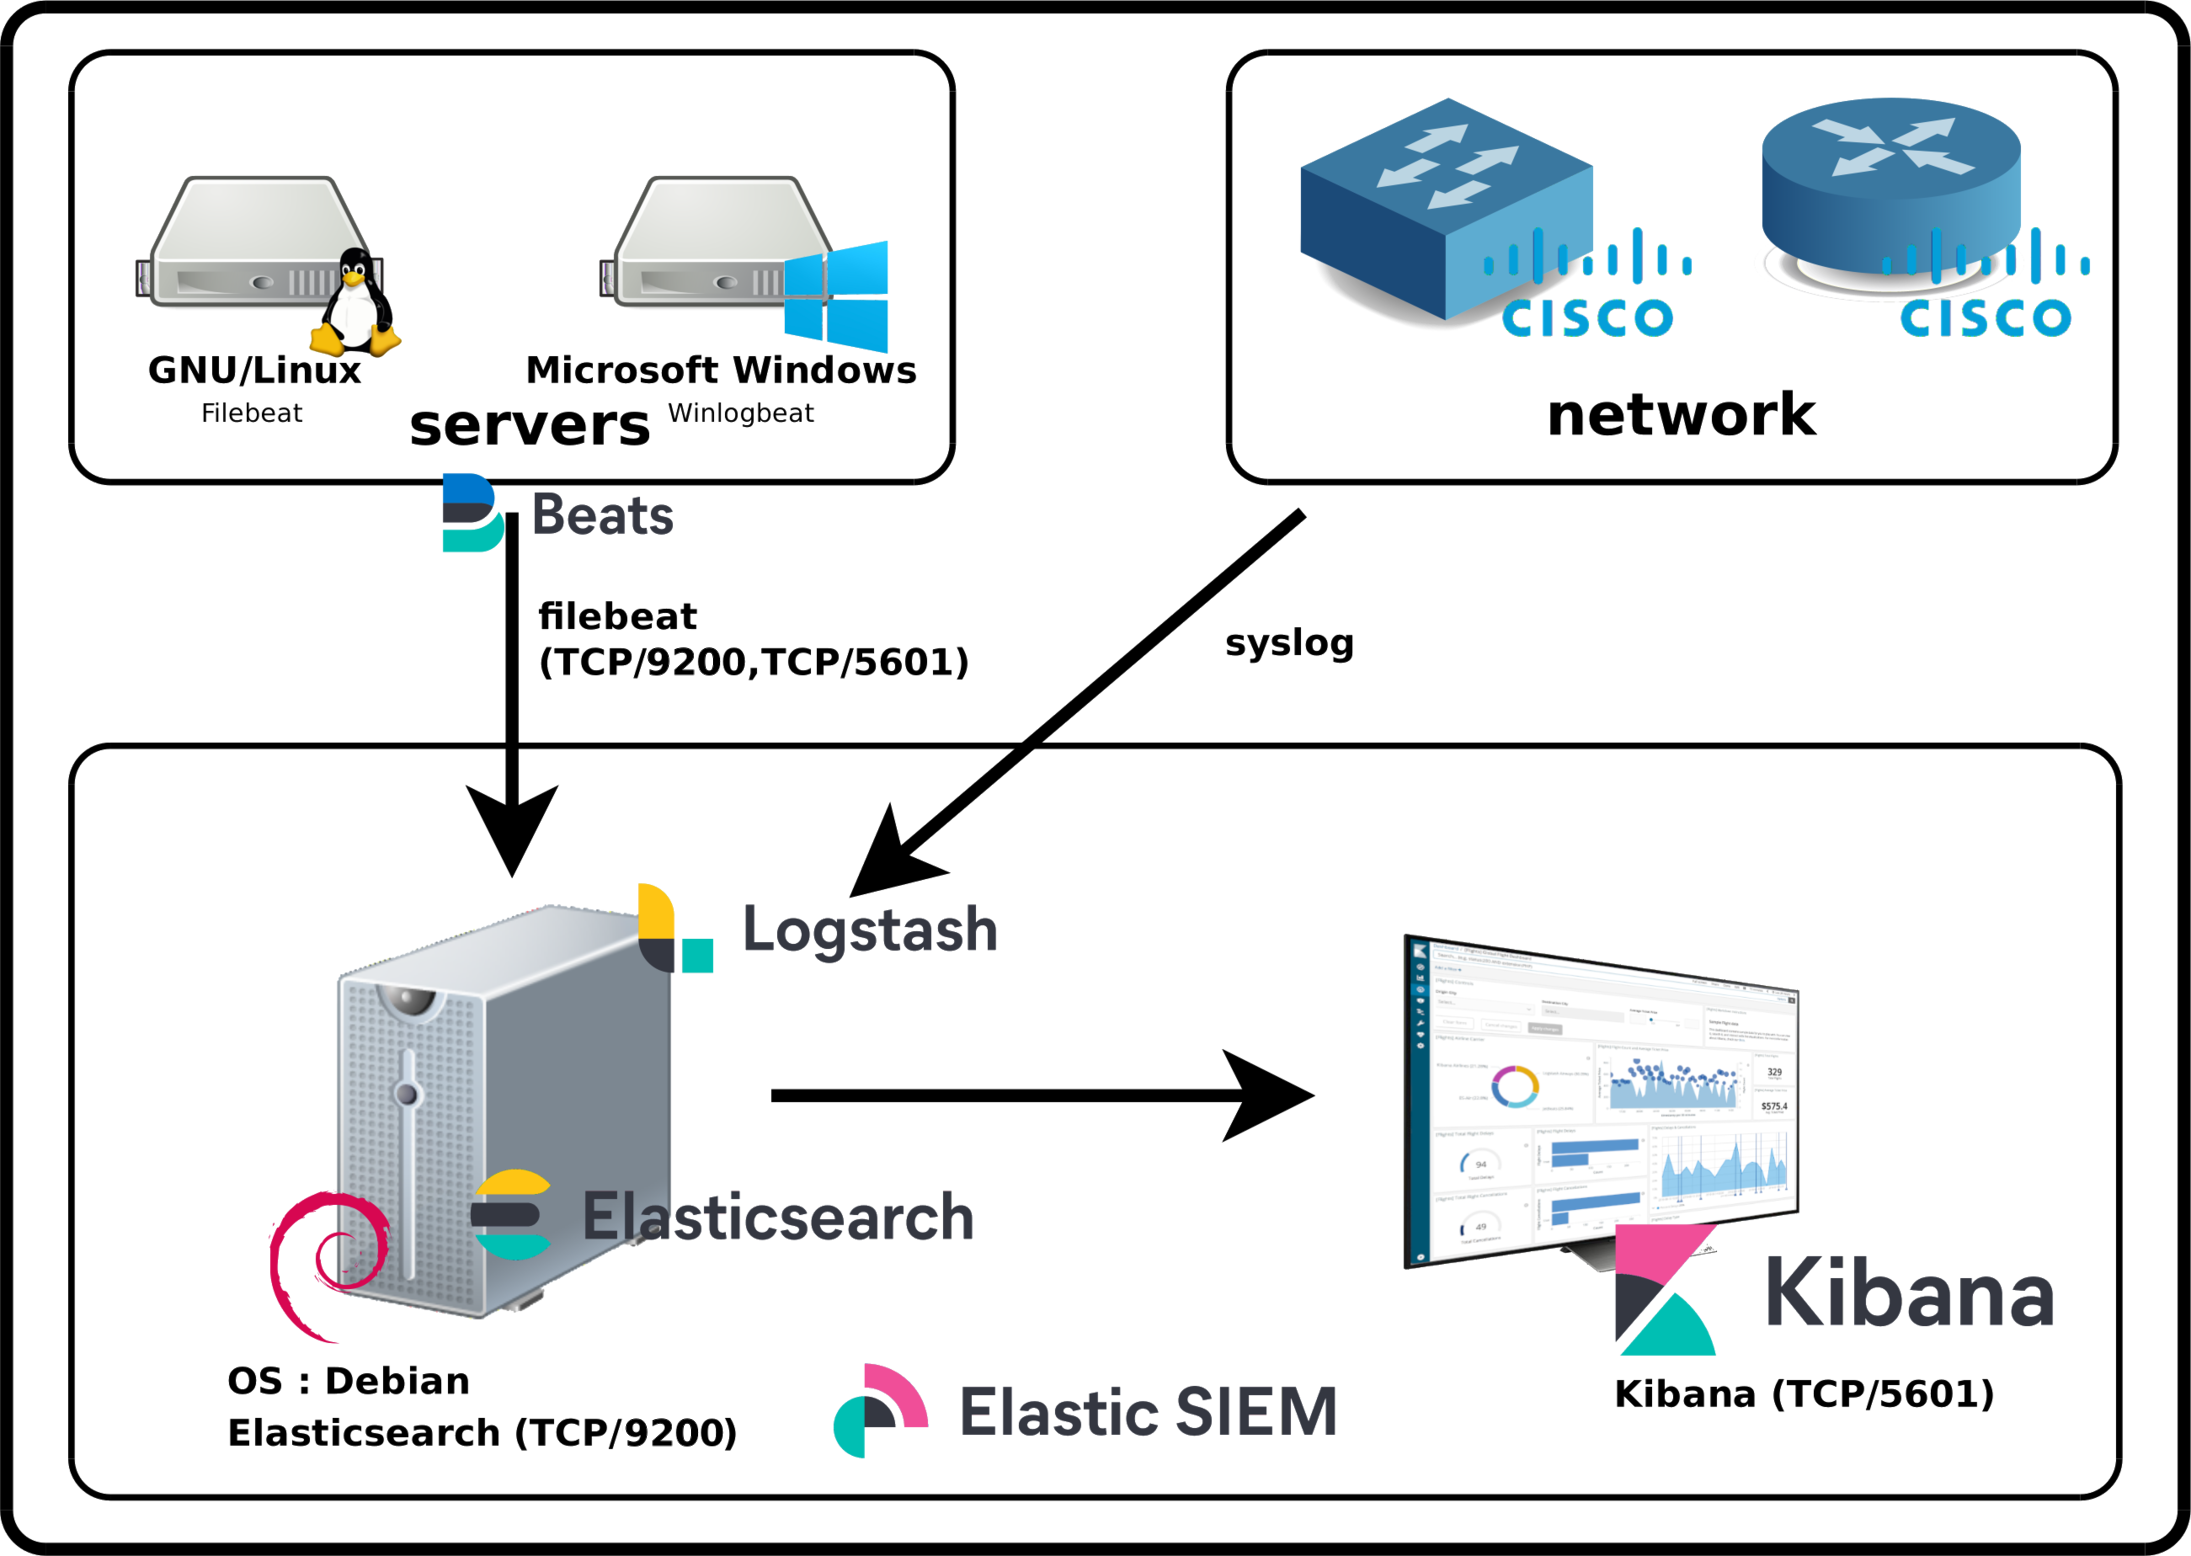
A SIEM for Security information and event management is a security solution which centralizes the logs and events of numerous devices in a computing network in order to process them and generate alerts in the event that abnormal behavior is detected.
We will see here how to deploy Elasticsearch solution.
Elasticsearch is a real-time, distributed storage, search, and analytics engine.
Kibana is an open source analytics and visualization platform designed to work with Elasticsearch. Kibana will be used to search, view, and interact with data stored in Elasticsearch indices.

We can install it, on a Debian system from raw packages or via Package Managers. We will see both methods.
root@host:~# wget https://artifacts.elastic.co/downloads/elasticsearch/elasticsearch-7.12.0-amd64.deb https://artifacts.elastic.co/downloads/elasticsearch/elasticsearch-7.12.0-amd64.deb.sha512 -P /tmp/
root@host:~# dpkg -i /tmp/elasticsearch-7.12.0-amd64.deb
root@host:~# wget https://artifacts.elastic.co/downloads/kibana/kibana-7.12.0-amd64.deb https://artifacts.elastic.co/downloads/kibana/kibana-7.12.0-amd64.deb.sha512 -P /tmp/
root@host:~# dpkg -i /tmp/kibana-7.12.0-amd64.deb
root@host:~# wget -qO - https://artifacts.elastic.co/GPG-KEY-elasticsearch | apt-key add -
root@host:~# apt update && apt-get install apt-transport-https
root@host:~# echo "deb https://artifacts.elastic.co/packages/7.x/apt stable main" | tee /etc/apt/sources.list.d/elastic-7.x.list
root@host:~# apt update && apt-get install elasticsearch
root@host:~# apt update && apt-get install kibana
network.host: 0.0.0.0
discovery.type: single-node
discovery.seed_hosts: ["0.0.0.0"]
node.name: std
root@host:~# systemctl start elasticsearch.service
root@host:~# curl http://127.0.0.1:9200
{
  "name" : "std",
  "cluster_name" : "elasticsearch",
  "cluster_uuid" : "StdgreaTBanDKphU4S0ceg",
  "version" : {
    "number" : "7.12.0",
    "build_flavor" : "default",
    "build_type" : "deb",
    "build_hash" : "ff17057114c2199c9c1bbecc727003a907c0db7a",
    "build_date" : "2021-02-15T13:44:09.394032Z",
    "build_snapshot" : false,
    "lucene_version" : "8.7.0",
    "minimum_wire_compatibility_version" : "6.8.0",
    "minimum_index_compatibility_version" : "6.0.0-beta1"
  },
  "tagline" : "You Know, for Search"
}
server.host: "0.0.0.0"
root@host:~# systemctl start kibana.service
root@host:~# curl -XGET 'http://localhost:9200/_cluster/health'
{"cluster_name":"elasticsearch","status":"yellow","timed_out":false,"number_of_nodes":1,"number_of_data_nodes":1,"active_primary_shards":18,"active_shards":18,"relocating_shards":0,"initializing_shards":0,"unassigned_shards":4,"delayed_unassigned_shards":0,"number_of_pending_tasks":0,"number_of_in_flight_fetch":0,"task_max_waiting_in_queue_millis":0,"active_shards_percent_as_number":81.81818181818183}

To make our Elasticsearch and Kibana services start at boot, we need to do some modifications.
TimeoutStartSec=300
root@host:~# systemctl enable elasticsearch.service
root@host:~# systemctl enable kibana.service
root@host:~# tail /var/log/elasticsearch/elasticsearch.log
root@host:~# tail /var/log/kibana/kibana.log
Contact :