Elastic Stack 8 - Logstash to monitor Cisco Switches Syslog
- Last updated: Apr 10, 2022

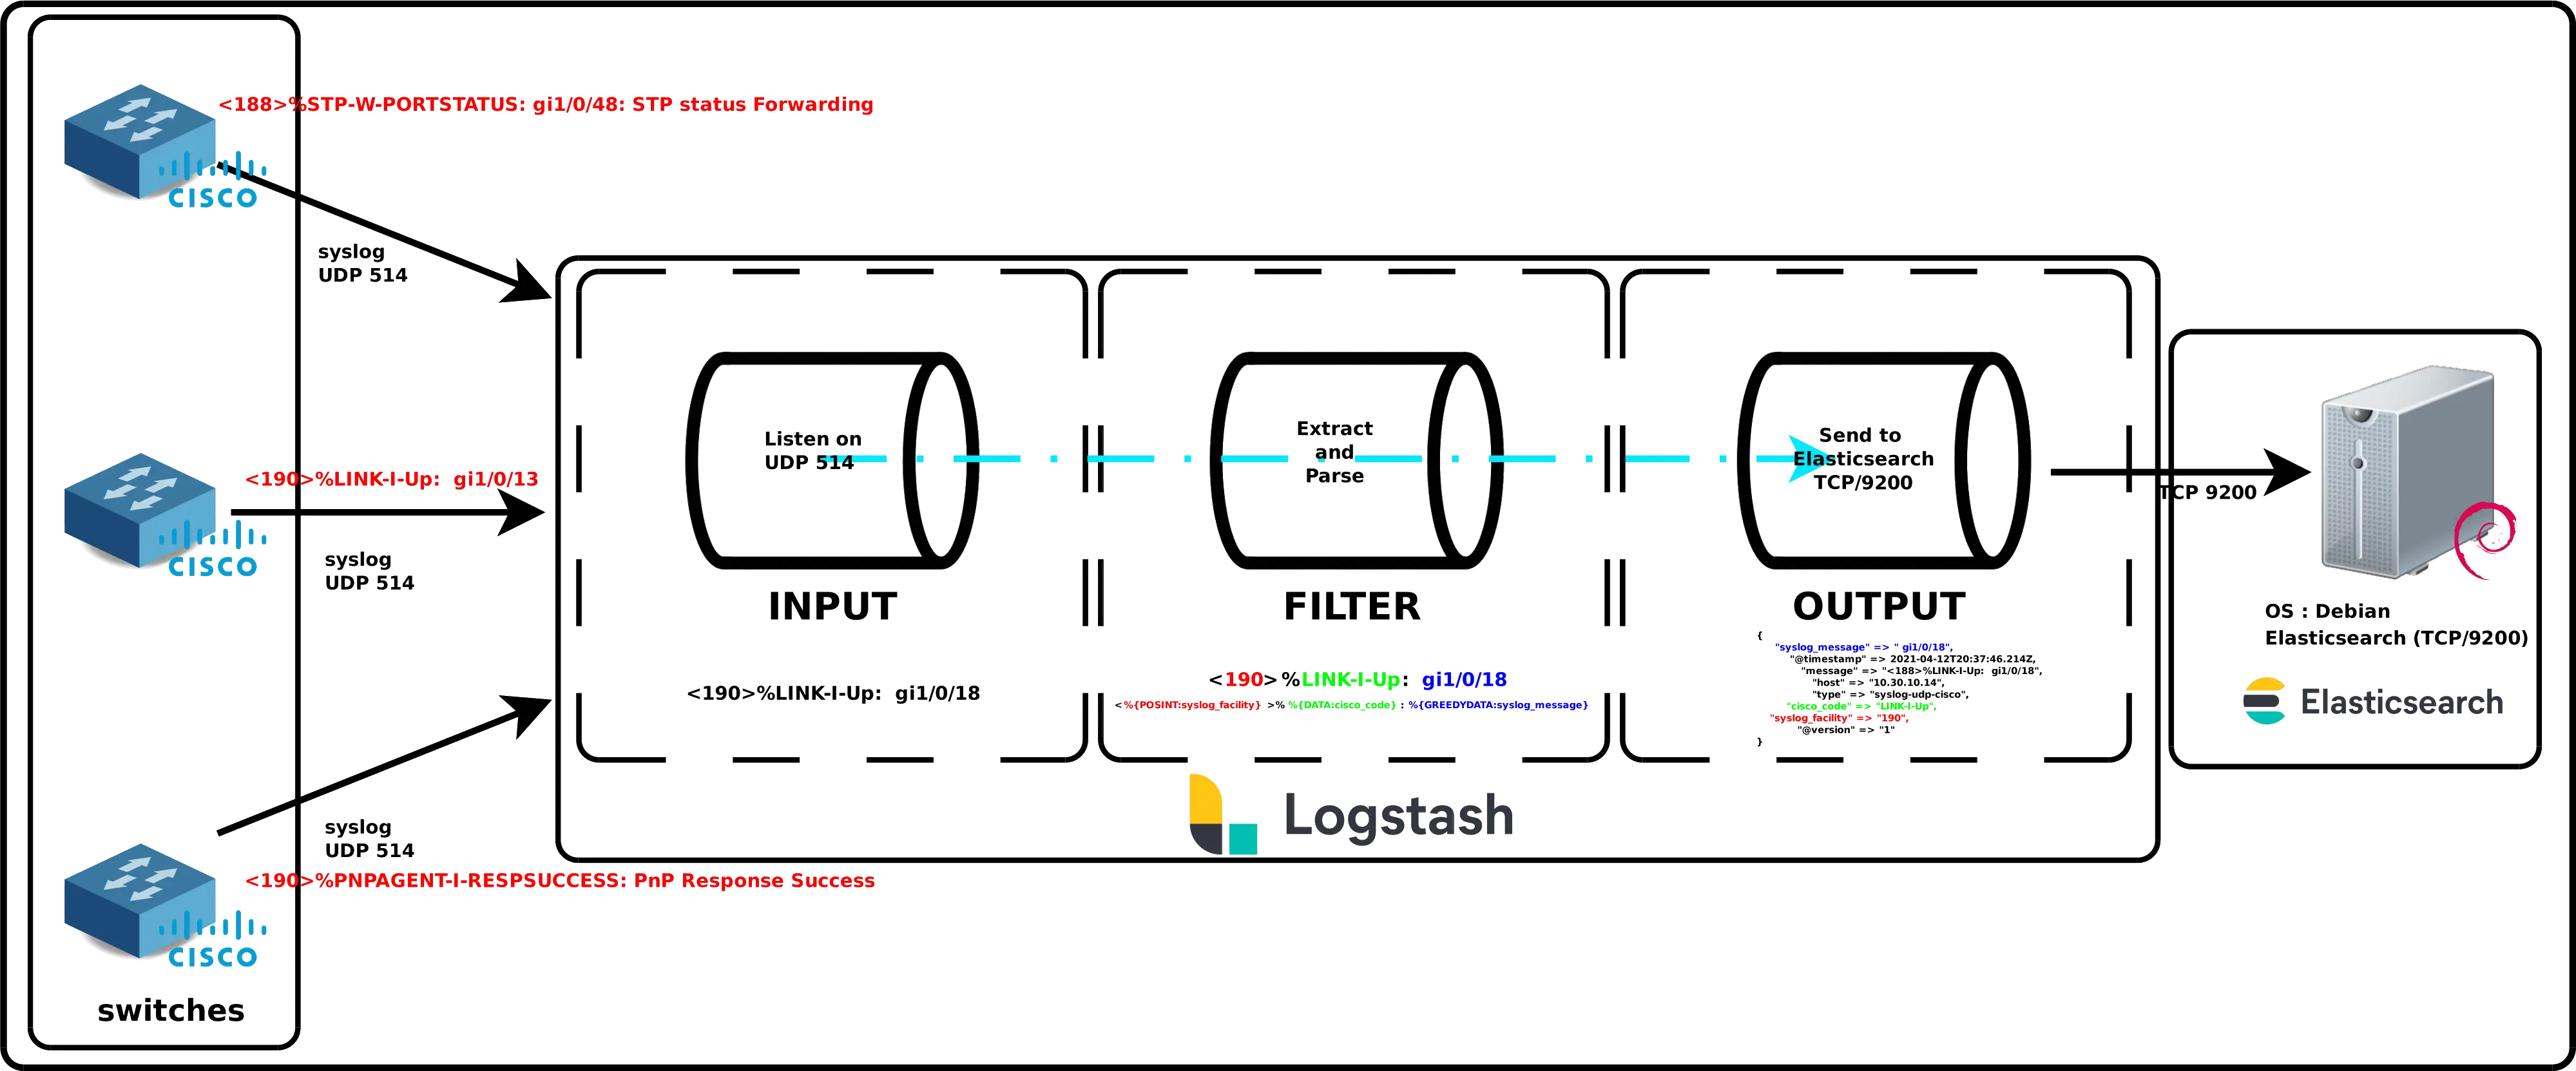
Now that our Elastic Stack is ready to go we can start to monitor some elements. I will start here with my Cisco Small Business/SG switches.
The Switches will use the syslog protocol to send infomations to logstash module.
Logstash will get the message, extracts and parses usefull informations then send them to Elasticsearch.
Understanding Logstash
Installing Logstash (Debian Server)
If you have not yet imported Elasticsearch PGP key and add repository definition, see part I.
- Install and enable Logstash:
root@host:~# apt install logstashService
- Check logstash service:
root@host:~# systemctl status logstash.service- Enable logstash at boot:
root@host:~# systemctl enable logstash.serviceLogs file
- Logstash:
root@host:~# tail /var/log/logstash/logstash-plain.logConfiguring
Pipeline files
Pipeline configuration files will define the stages of our Logstash processing pipeline. The pipeline configuration files are in the /etc/logstash/conf.d directory.
cisco.conf
- Create
/etc/logstash/conf.d/cisco.conffile:
input {
	udp {
		port => "514"
		type => "syslog-udp-cisco"
	}
}

filter {
	grok {
		#Remember, the syslog message looks like this : <190>%LINK-I-Up: gi1/0/13
		match => { "message" => "^<%{POSINT:syslog_facility}>%%{DATA:cisco_code}: %{GREEDYDATA:syslog_message}" }
	}
}
output {
	elasticsearch {
		hosts           => ["https://127.0.0.1:9200"]
                ssl             => true
                user            => "elastic"
                password        => "elastic_password;)"
                index           => "cisco-switches-%{+YYYY.MM.dd}"
                ssl_certificate_verification => false

	}
}
Pipeline file : explained and detailed
As we can see above, the logstash file consists of three parts : input, filter and output.
Input
Here we simply declare on which port we will listen our syslog frames.
- UDP protocol:
udp {- Specify the port number to listen to:
port => "514"- Add
syslog-udp-ciscotag to matched rule (it will also be shown on output):
type => "syslog-udp-cisco"Filter
This is the hard part of our Logstash configuration. It is where we will extract useful informations from our frames. The goal is to split each messages into several parts.
For example with our Cisco syslog messages look like this : «<190>%LINK-I-Up: gi1/0/13» so we would like to split it like this : <syslog_facility>%Cisco Action: Message.

- Good to know the commonly used patterns:
- WORD: pattern matching a single word
- NUMBER: pattern matching a positive or negative integer or floating-point number
- POSINT: pattern matching a positive integer
- IP: pattern matching an IPv4 or IPv6 IP address
- NOTSPACE: pattern matching anything that is not a space
- SPACE: pattern matching any number of consecutive spaces
- DATA: pattern matching a limited amount of any kind of data
- GREEDYDATA: pattern matching all remaining data
Output
Once we have our data correctly organized we can send them to our Elasticsearch server.
- Specify our address:
hosts => ["http://127.0.0.1:9200"]- Set index in order to give a correct name to our datas:
index => "cisco-switches-%{+YYYY.MM.dd}"Cisco Switches
- We need to configure our switches to enable logging and precise the ip address of our Logstash server:
Switch(config)# logging host 192.168.1.200 port 514Misc
Check pipeline file
- If we want to check our pipeline file:
root@host:~# /usr/share/logstash/bin/logstash -f /etc/logstash/conf.d/pipeline.conf --config.test_and_exitManually test a pipeline output
- Stop logstash service:
root@host:~# systemctl stop logstash.service- Add listening port and stdout to your pipeline file, in order to watch output on console:
input {
	tcp {
		port => "514"
		type => "syslog-tcp-telnet"
	}
}

[…]
output {
	stdout { codec => rubydebug }
}- Run logstash:
root@host:~# /usr/share/logstash/bin/logstash -f /etc/logstash/conf.d/cisco.conf --config.reload.automatic- Use telnet to connect to your logstash listening port (only work with TCP protocol):
root@host:~# telnet 192.168.1.200 514
<190>%LINK-I-Up: gi1/0/13
List indexes
Now that our switches are properly configured we can check that there are well recorded in our elasticsearch database.
- To do so:
root@host:~# curl --cacert /etc/elasticsearch/certs/http_ca.crt -u elastic https://localhost:9200/_cat/indices?v
Enter host password for user 'elastic':
health status index                             uuid                   pri rep docs.count docs.deleted store.size pri.store.size
green  open   .apm-agent-configuration          rkV4oelEQzC7zJ19_NYbcw   1   0          0            0       208b           208b
green  open   .kibana_1                         rtWr4Pk-TKmYrQ_jQ7Oi4Q   1   0       1689           93      2.6mb          2.6mb
green  open   .apm-custom-link                  Yo72Y9STSAiuSUWT40AJnw   1   0          0            0       208b           208b
green  open   .kibana_task_manager_1            o_uGNd0mQSu6X5_th3P2ng   1   0          5        50053      4.5mb          4.5mb
green  open   .async-search                     3RGoSaTXRLizPMce1I169w   1   0          3            6       10kb           10kb
yellow open   cisco-switches-2022.04.12         gs_PaI2iT_CMQhABskEB6g   1   1      17109            0      1.5mb          1.5mb
green  open   .kibana-event-log-7.10.2-000002   r_1sdbv0QW2XNR0bcvZN2g   1   0          1            0      5.6kb          5.6kb
yellow open   cisco-switches-2022.04.08         j9yz1SWzRwaG_int0rX4YQ   1   1       2283            0    338.1kb        338.1kb
- Print index content:
root@host:~# curl --cacert /etc/elasticsearch/certs/http_ca.crt -u elastic 'https://localhost:9200/cisco-switches-2022.04.08/_search?pretty&q=response=200'
Enter host password for user 'elastic':
{
"_index" : "cisco-switches-2021.04.08",
"_type" : "_doc",
"_id" : "1XV3wngBMGalcfKW8ROi",
"_score" : 3.052513,
"_source" : {
"syslog_message" : "PnP Response Success",
"@timestamp" : "2021-04-11T19:45:43.739Z",
"message" : "<190>%PNPAGENT-I-RESPSUCCESS: PnP Response Success",
"host" : "192.168.0.15",
"type" : "syslog-udp-cisco",
"cisco_code" : "PNPAGENT-I-RESPSUCCESS",
"syslog_facility" : "190",
"@version" : "1"
}
},
Kibana
Check indices
Now that we have our data inside indexes it's time to create a dashboard in kibana to have a graphical view of our swicthes logs.
- Open Firefox and go to
http://KIBANA_IP_SERVER:5601/address
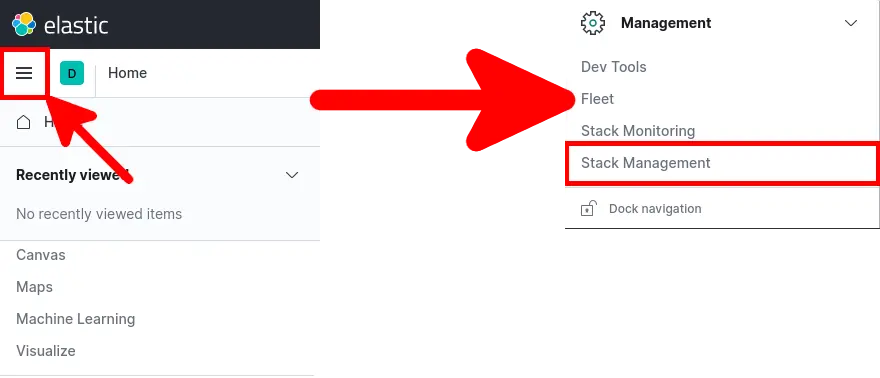
- Open main menu and go to Management > Stack Management:
- From Stack Management go to Data > Index Management:

- You should see your indices:

Create index pattern
We will create an index pattern which will match our cisco data sources.
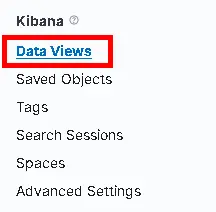
- Go to main menu and go to Management > Stack Management > Data Views:
- Click Create data view:

- Type «
cisco-switches-» to match all data sources:

Create dashboard
We now have everything to make beautiful graphs.
Pie
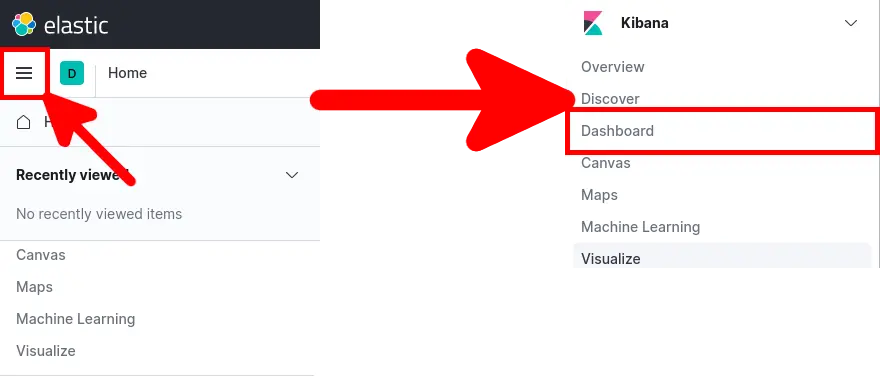
- Open main menu and go to Kibana > Dashboard:
- From there click Create dashboard:

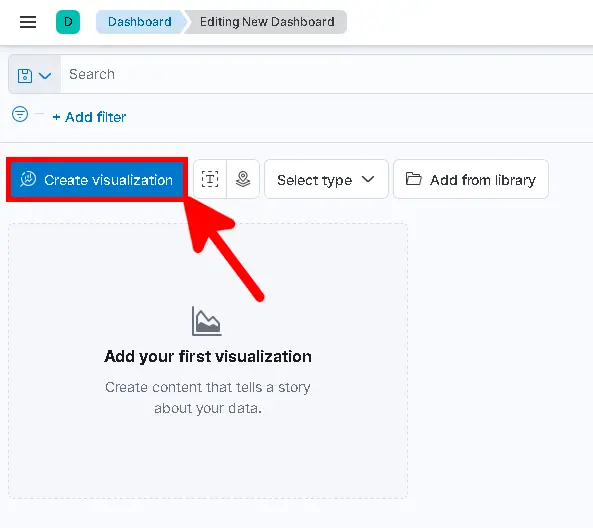
- Click Create visualization to create object:
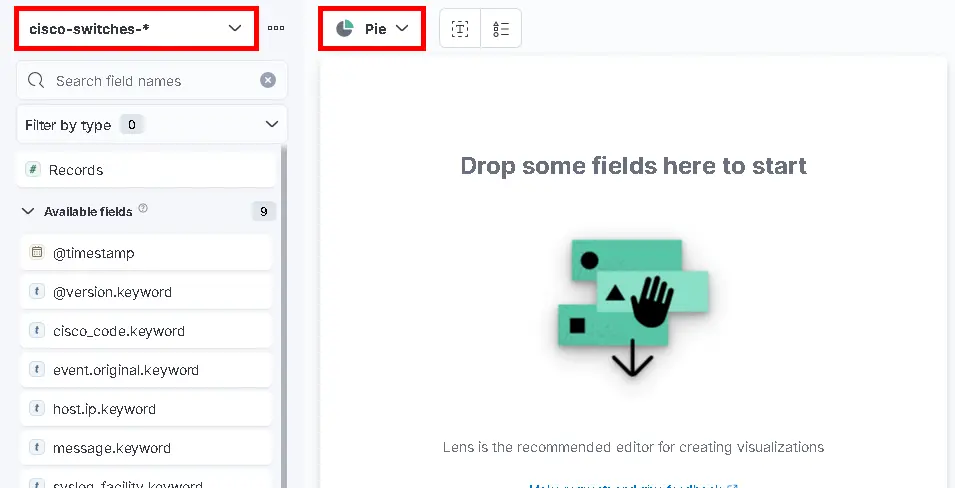
- Select Pie as chart type and
cisco-switches-*data view:
- Click and drop fields
host.keywordandcisco_code.keyword:

- You should see this beautiful Pie, click Save:

- Give a Title and click Save and return:

- Now you can see the Pie on your Dashboard:

Table
- From dashboard click Edit and Create visualization:

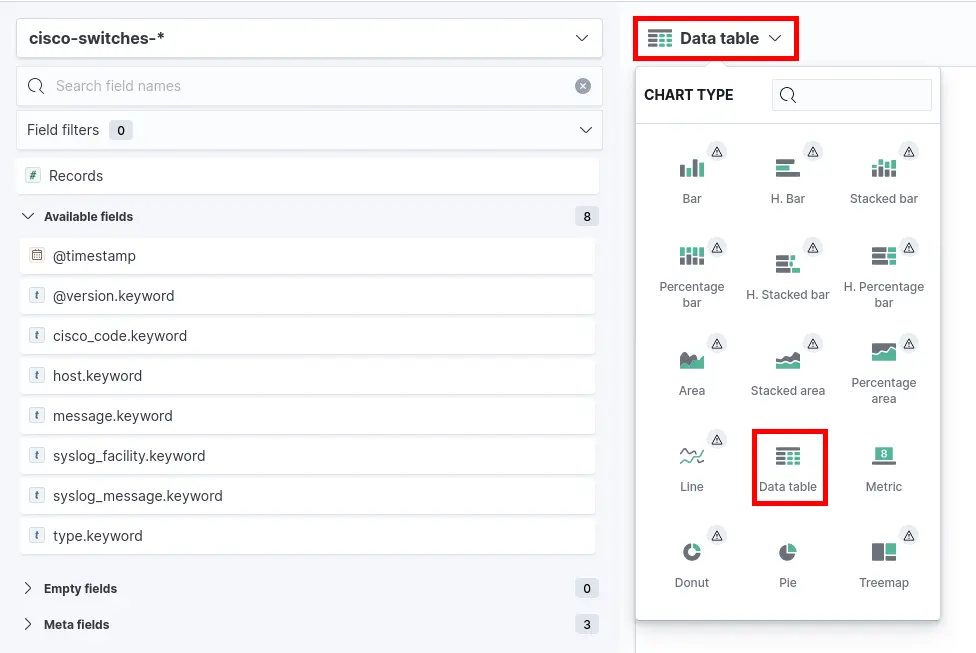
- Select Table as chart type:
- Click and drop fields
host.keyword,syslog_message.keywordandcisco_code.keyword:

- You should see this beautiful Data table, click Save:

- Give a Title and click Save and return:

- Now Save your Dashboard to keep changes:
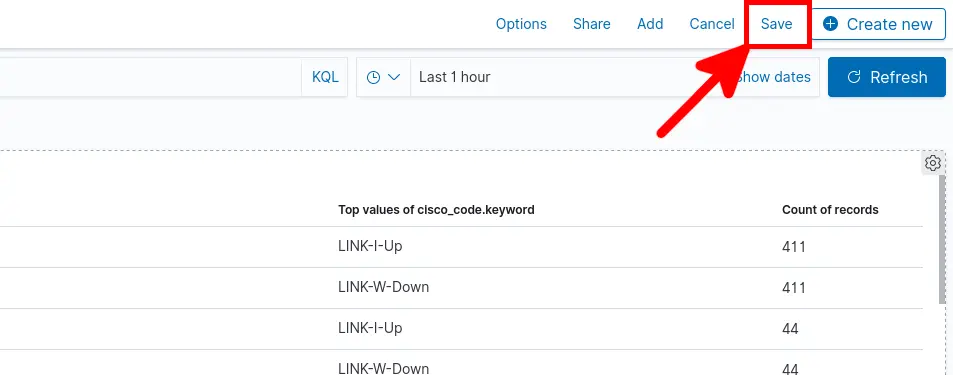
- Give a Title and click Save:
