Monitoring Cisco Firepower Firewalls with Filebeat on Elastic Stack 8
- Last updated: Apr 25, 2025

Cisco Firepower is the worst firewall in the entire universe, but this is not the object here… I'm only going to talk about monitoring this crap in a Elastic Stack environment.
To do this, we're going to work with the Filebeat module.
One good thing is that Filebeat comes with a Cisco module that can handle Firepower logs sent via syslog. The bad thing is that there is no preset dashboard so we will have to create one manually.
Filebeat Architecture

Configuring Cisco Firepower
The first step is to configure our Cisco Firepower device to send syslog information to our Filebeat agent. We need to declare the syslog server and enable syslog for the rules we want to monitor.
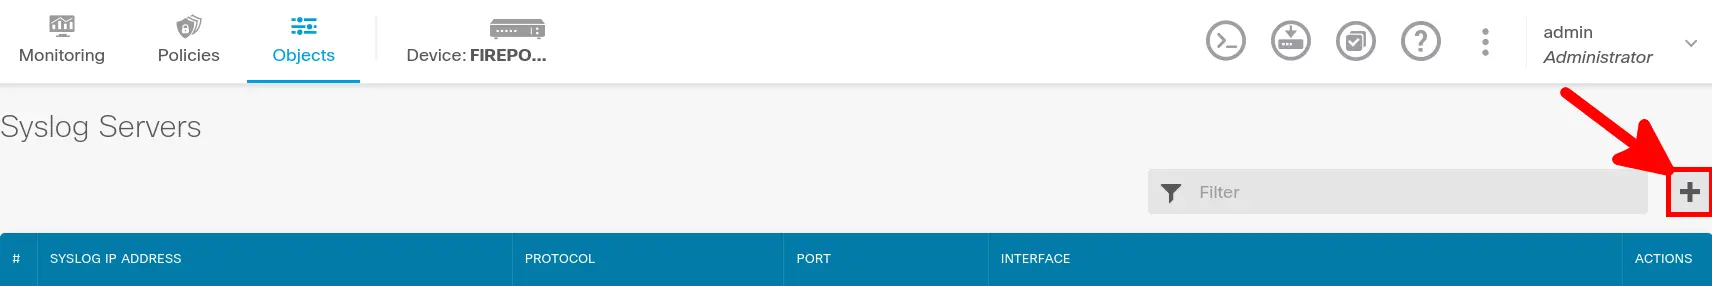
Add syslog server object
- Go to Objects > Syslog servers and click Add button:
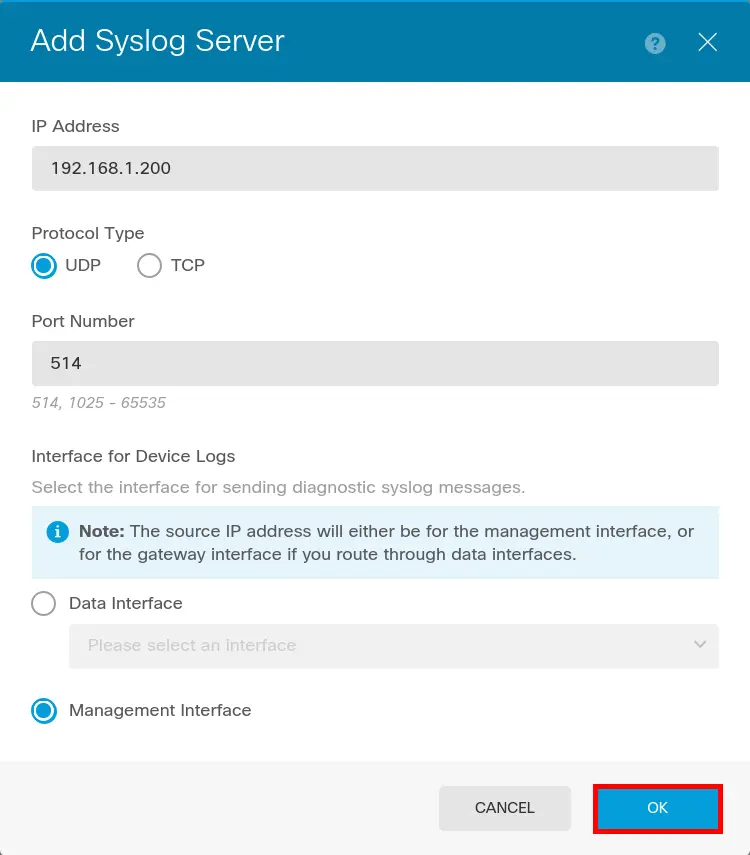
- Enter Syslog server information (which is our elastic server) then click OK:
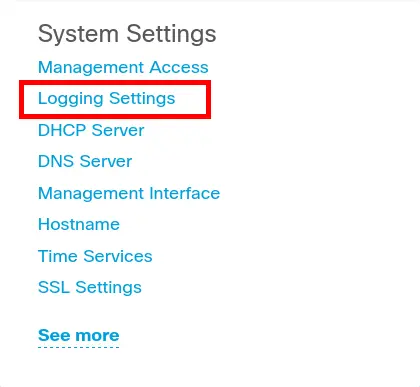
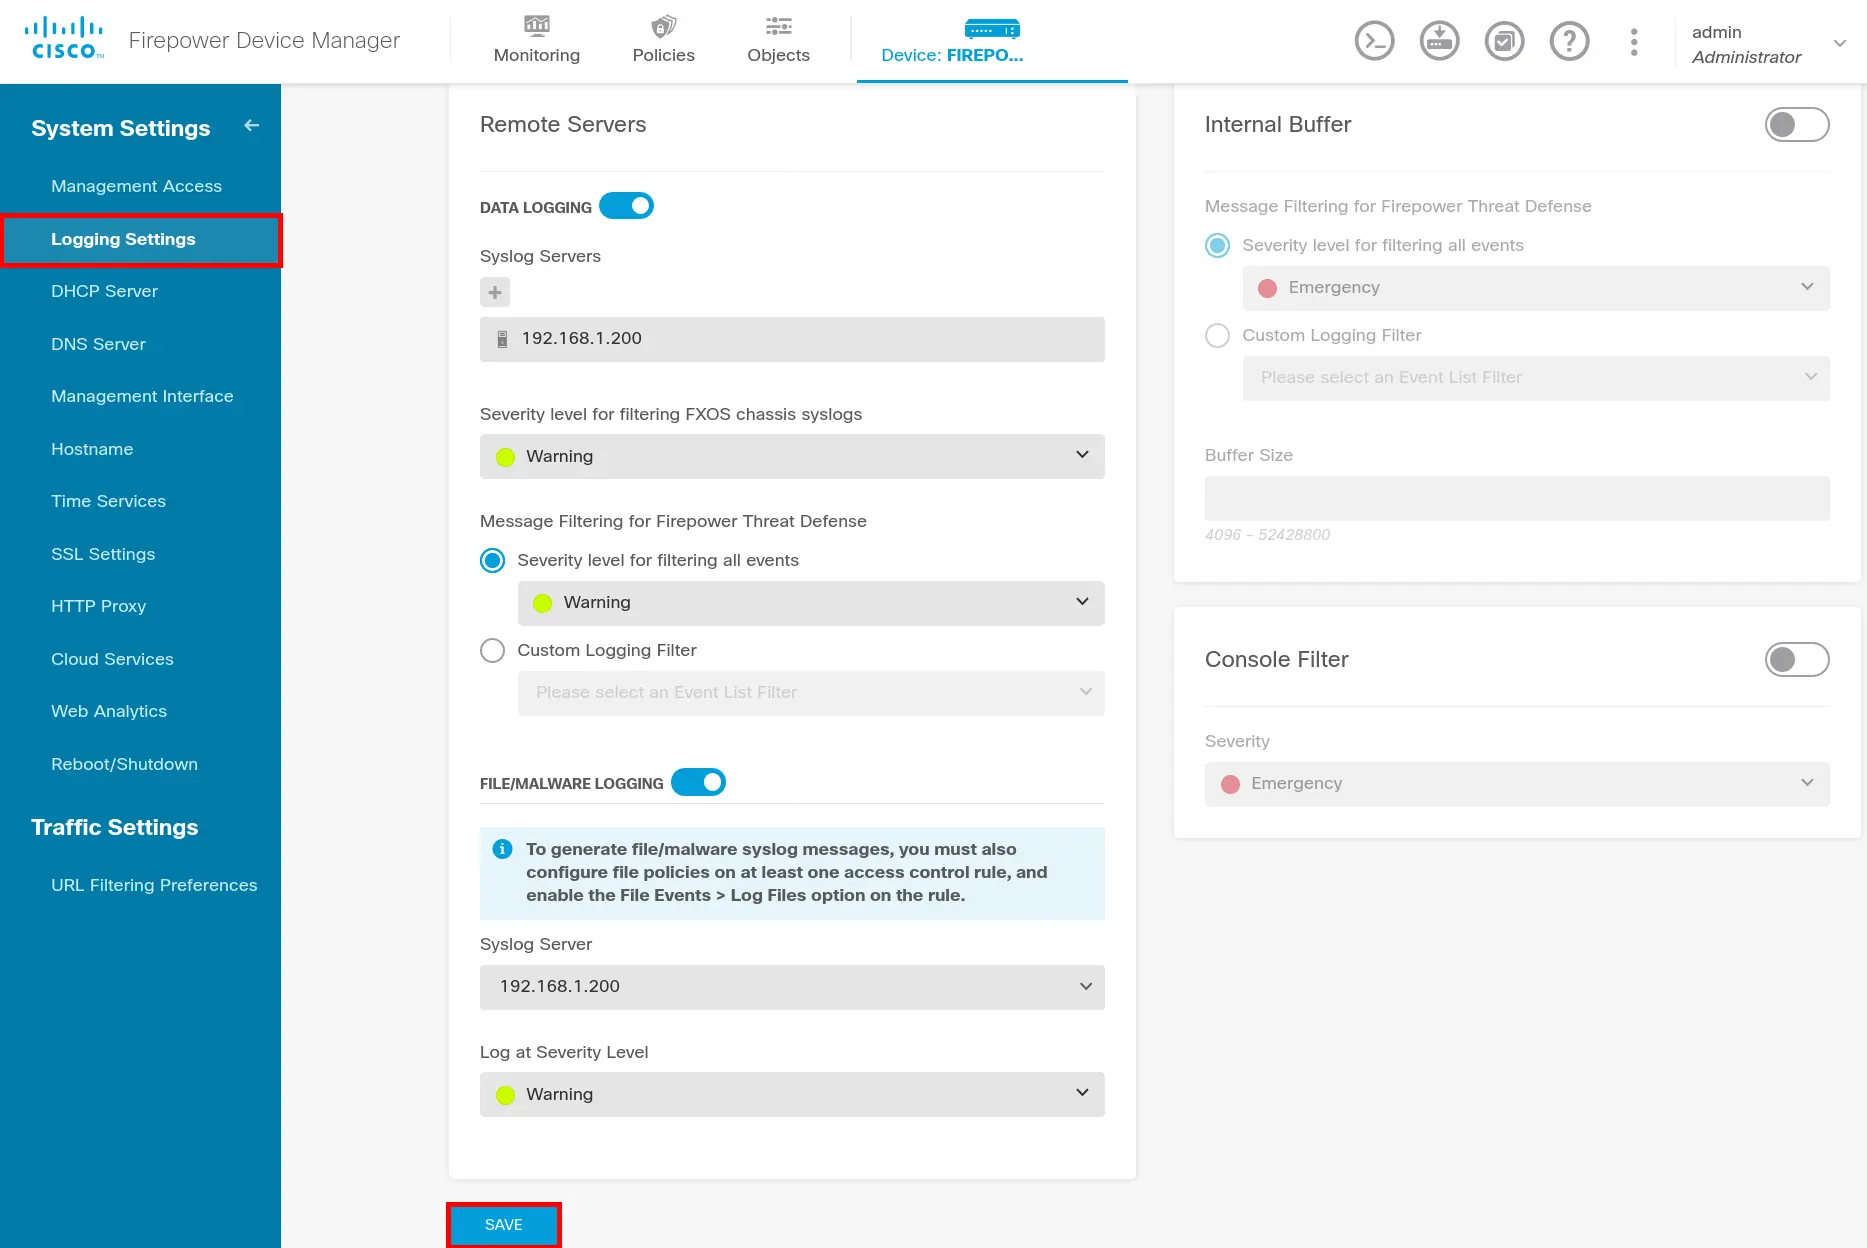
Configure logging
- From main Firewall configuration page go to Logging Settings:
- Go to Logging Settings menu and configure Logging:
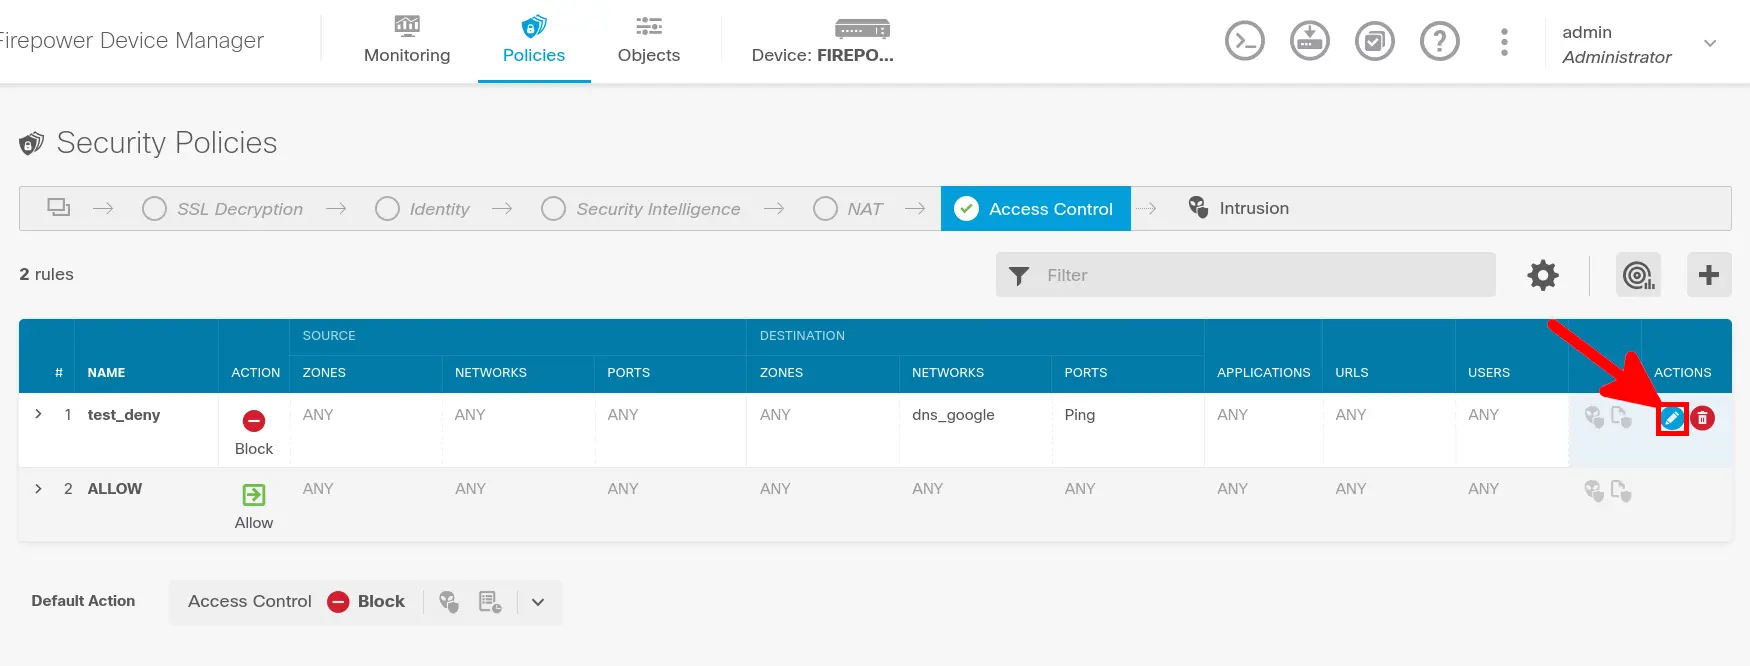
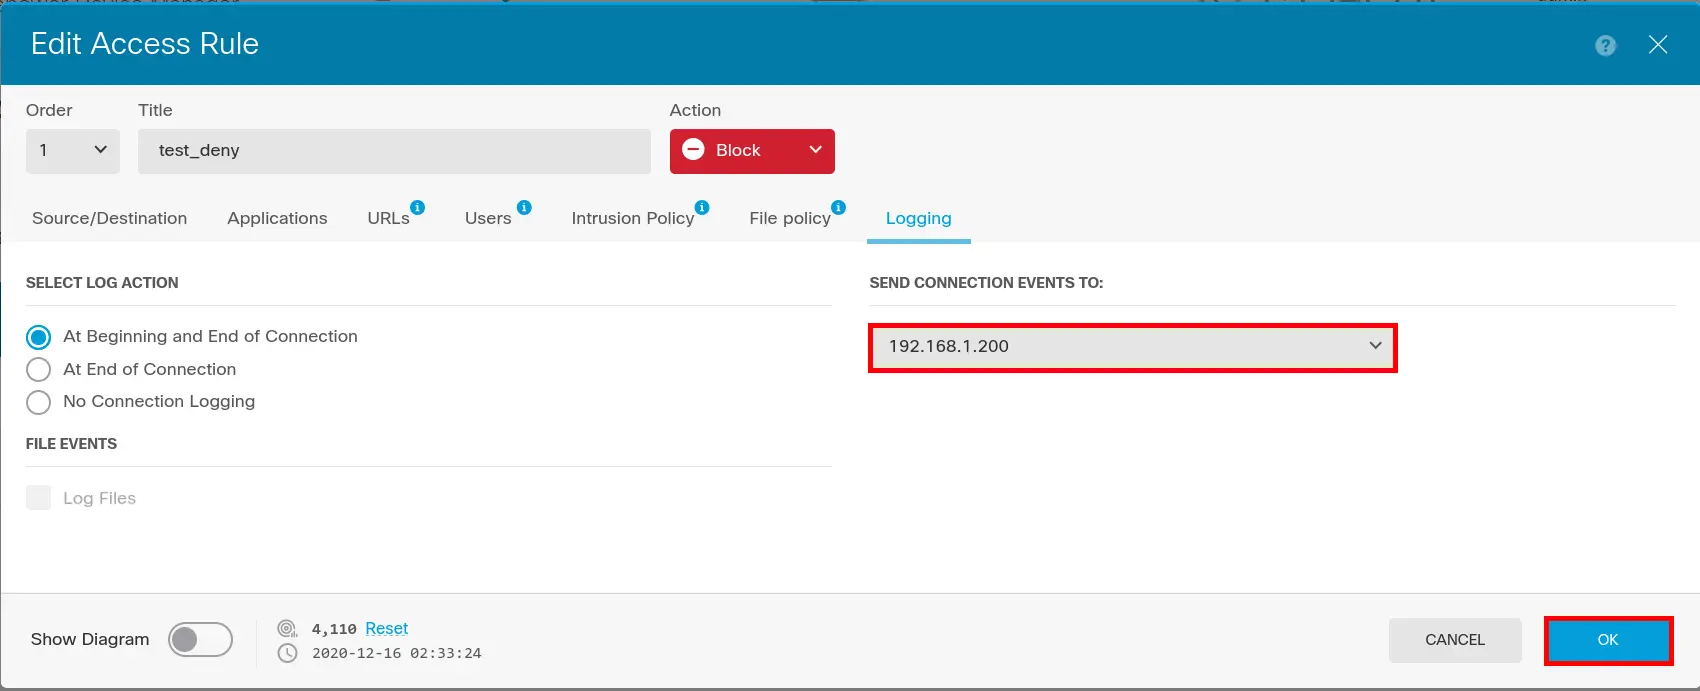
Enable syslog to rules
- Edit Firewall rule(s) you want to monitor:
- Enable Logging:
Installing Filebeat
If you have not yet imported Elasticsearch PGP key and add repository definition, see part I.
- Install Filebeat:
root@host:~# apt install filebeat- Edit
/etc/filebeat/modules.d/cisco.ymlto enable ftd/firepower module:
  ftd:
    enabled: true

    var.syslog_host: 0.0.0.0
var.syslog_port: 514- Edit
/etc/filebeat/filebeat.ymlto set filebeat:
# ---------------------------- Elasticsearch Output ----------------------------
output.elasticsearch:
  # Array of hosts to connect to.
  hosts: ["localhost:9200"]

  # Protocol - either `http` (default) or `https`.
  protocol: "https"

  # Authentication credentials - either API key or username/password.
  #api_key: "id:api_key"
  username: "elastic"
  password: "elastic_password;)"
  ssl.verification_mode: none


# =================================== Kibana ===================================

# Starting with Beats version 6.0.0, the dashboards are loaded via the Kibana API.
# This requires a Kibana endpoint configuration.
setup.kibana:

  # Kibana Host
  # Scheme and port can be left out and will be set to the default (http and 5601)
  # In case you specify and additional path, the scheme is required: http://localhost:5601/path
  # IPv6 addresses should always be defined as: https://[2001:db8::1]:5601
  host: "https://X.X.X.X:5601"
  ssl.verification_mode: none
- Restart Filebeat:
root@host:~# systemctl restart filebeatKibana
Check logs
Wait some minutes and open kibana.
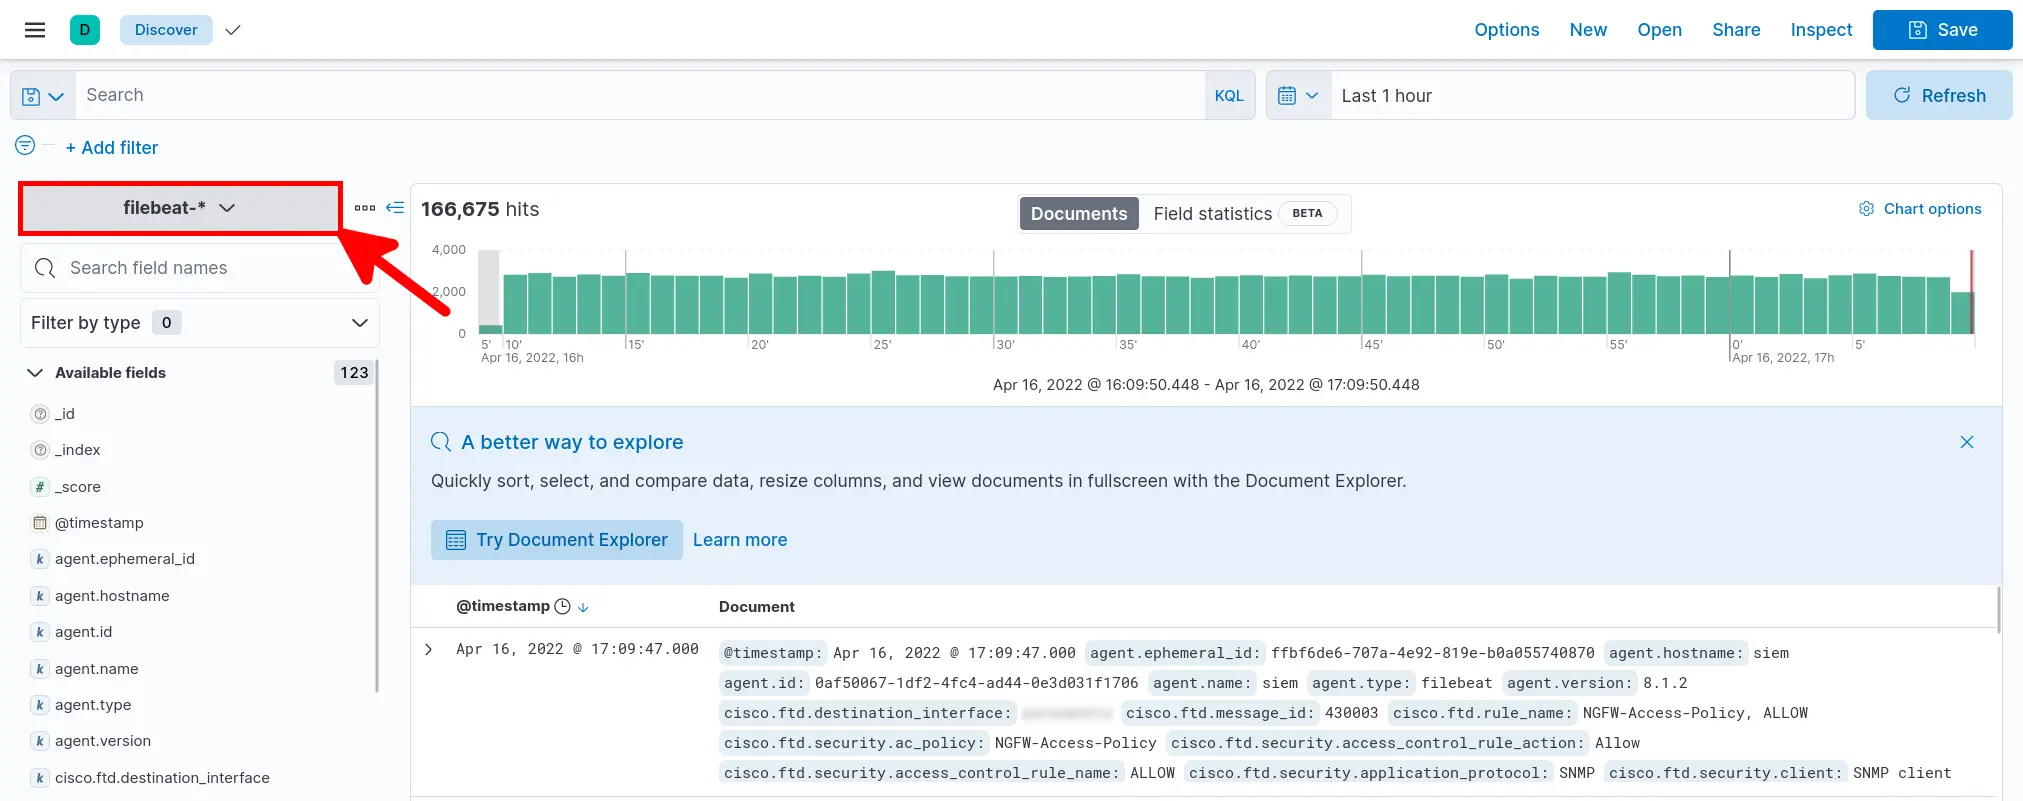
- Go to Analytics > Discover:

- Select filebeat-* and verify that your data is arriving:
Dashboard
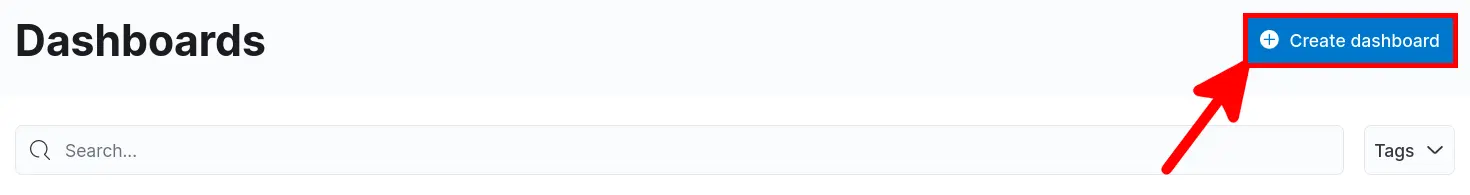
There is no predefined dashboard for Firepower devices, so we need to create a new one.
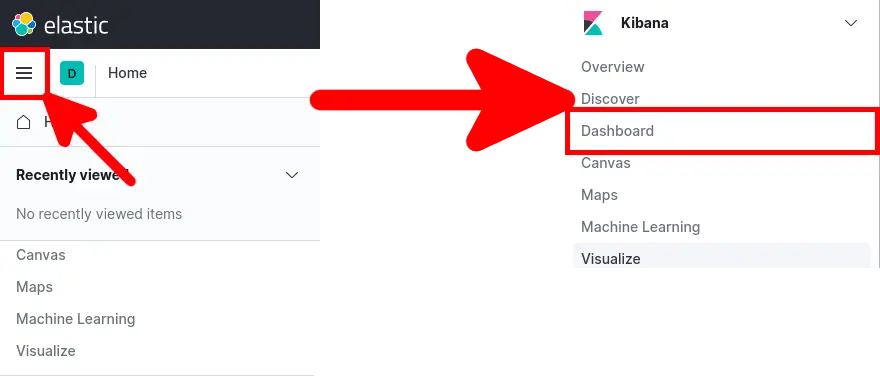
- Open main menu and go to Kibana > Dashboard:
- Click Create dashboard:
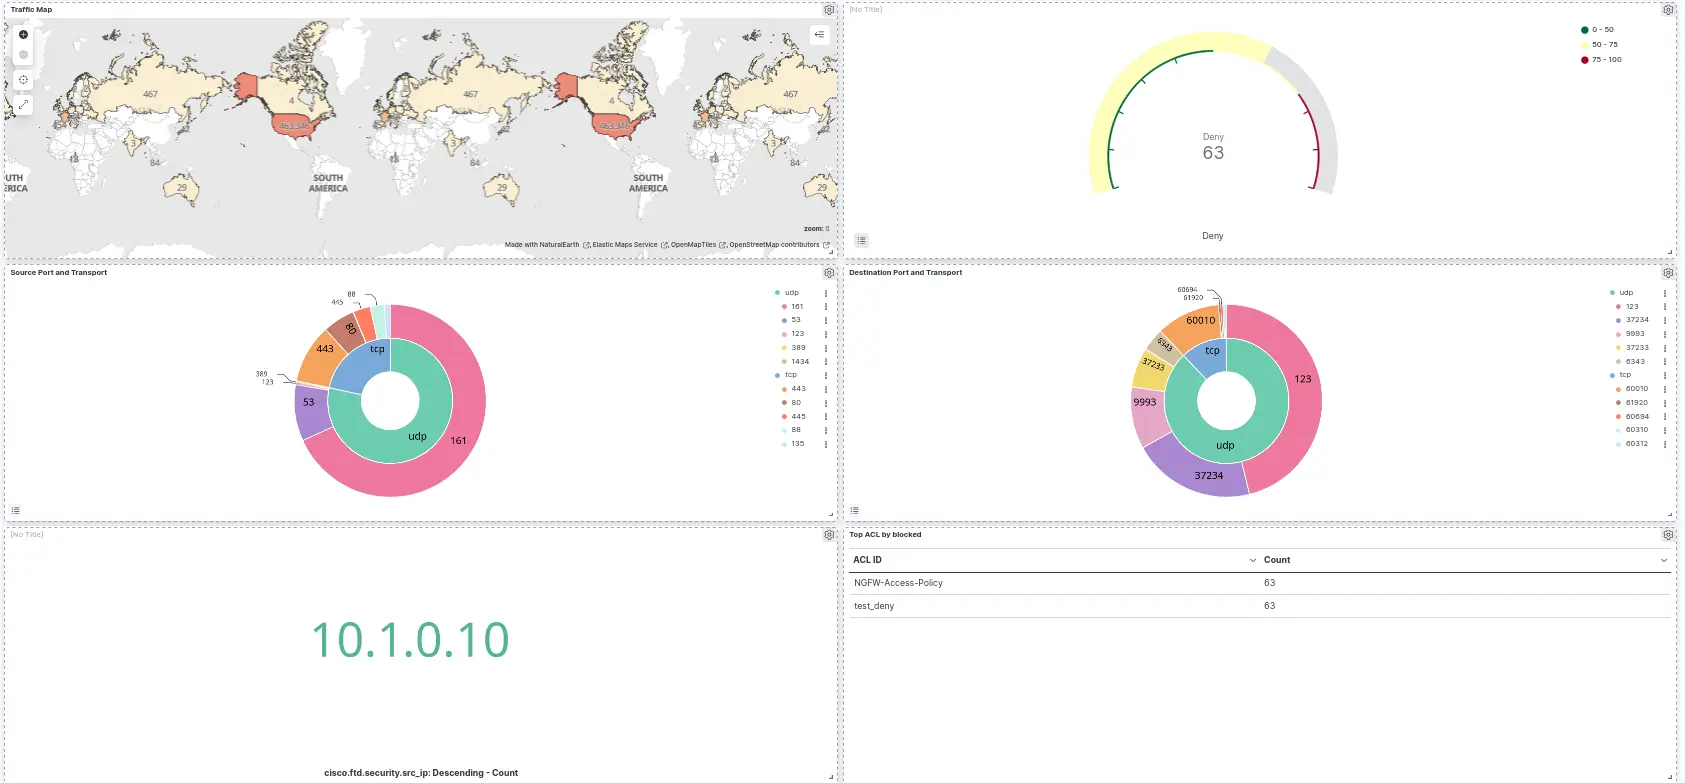
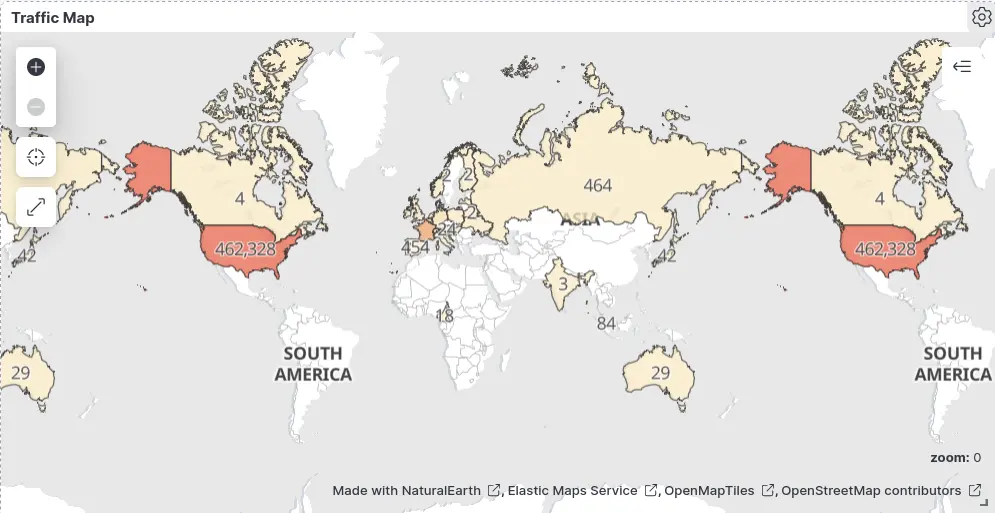
Maps
Goal
Procedure
- Click Create new Maps icon:
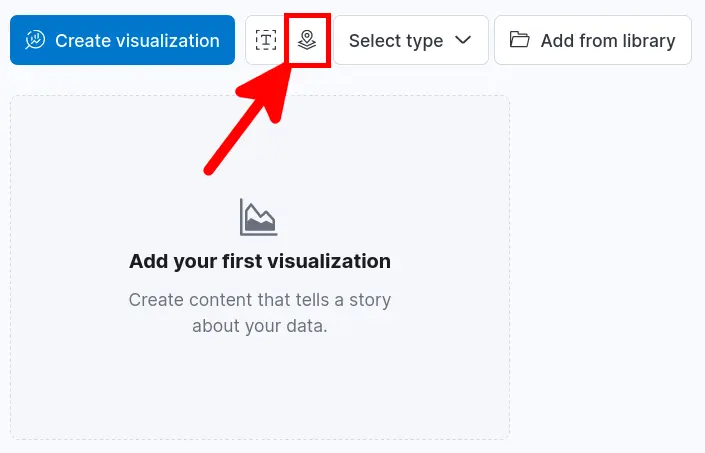
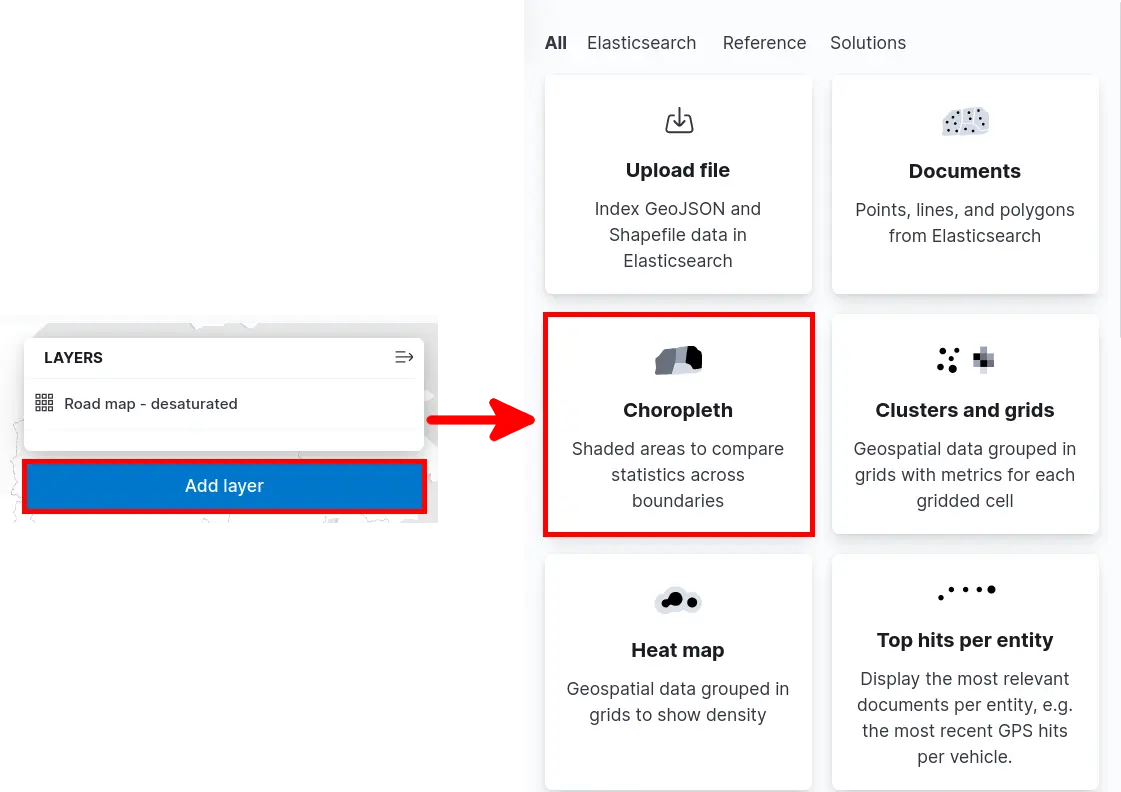
- Click Add layer > Choropleth:
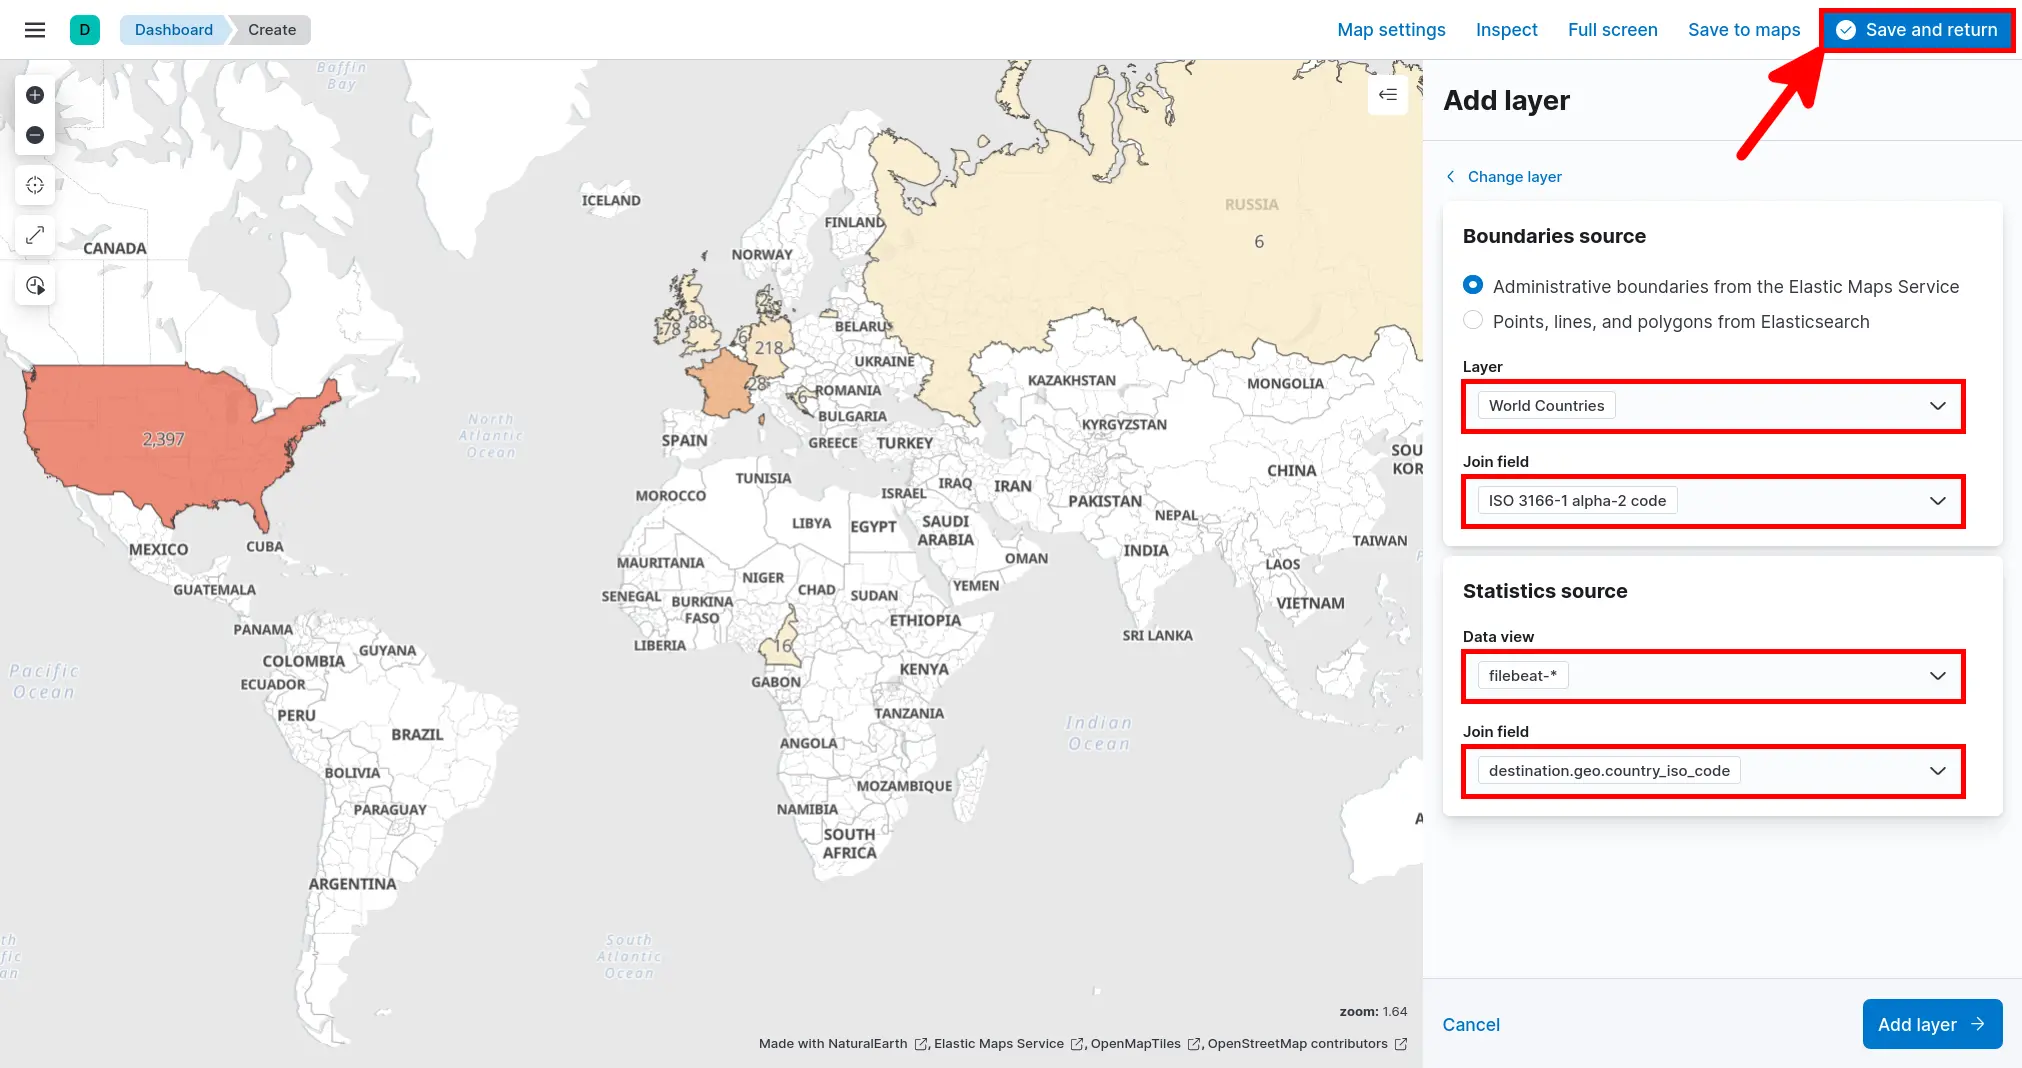
- Set Boundaries source and Statistics source parameters, then click Save and return:
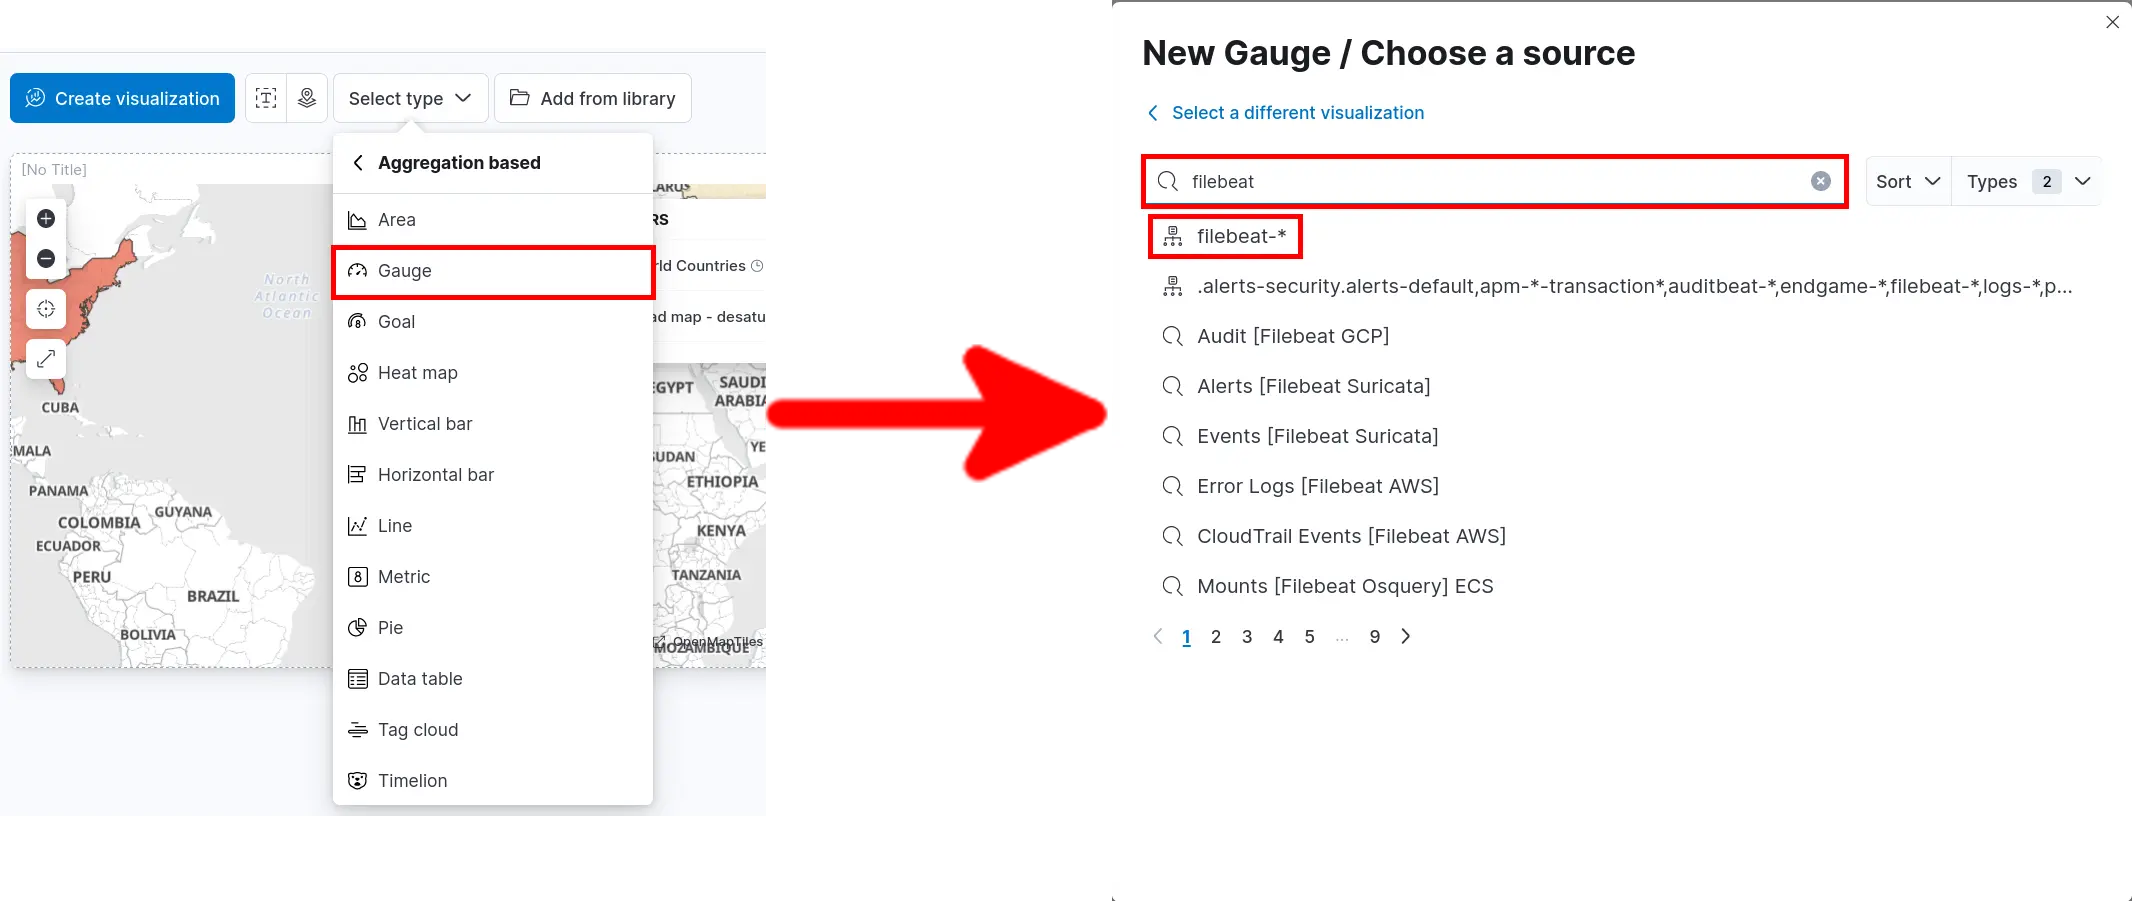
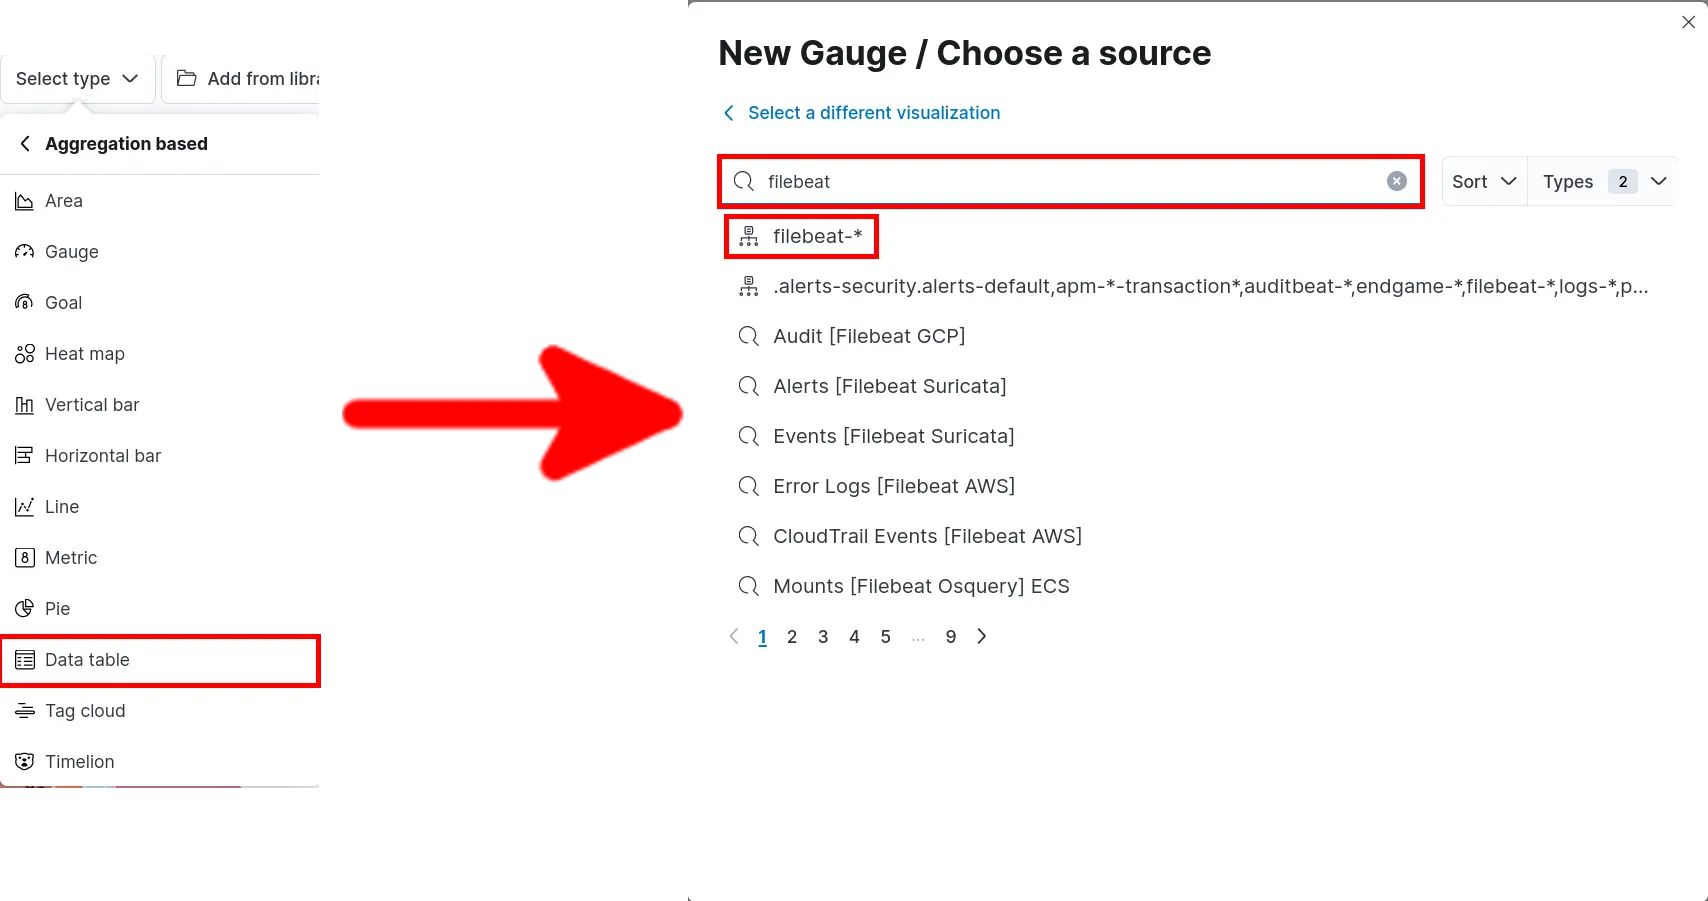
Gauge
Goal
Procedure
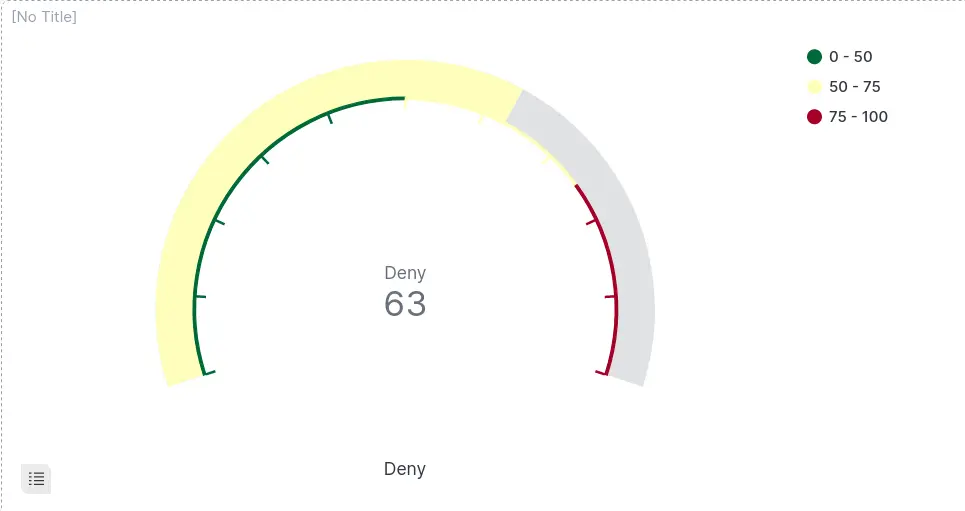
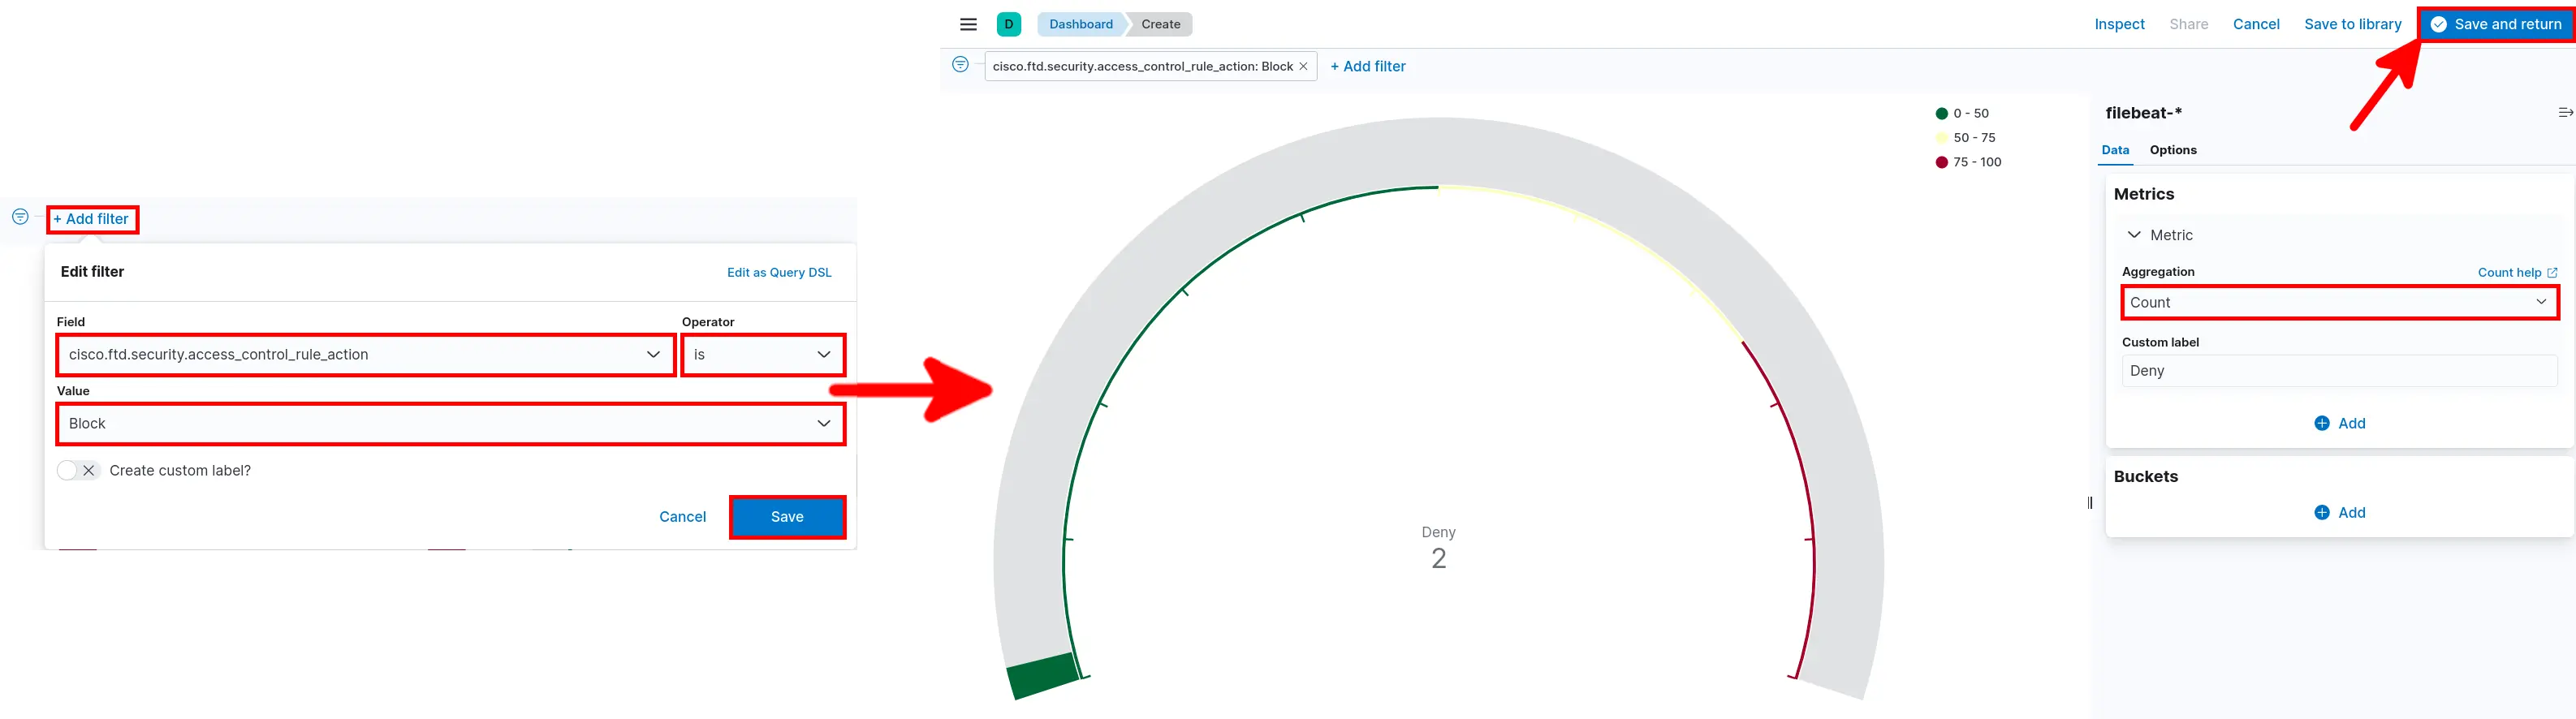
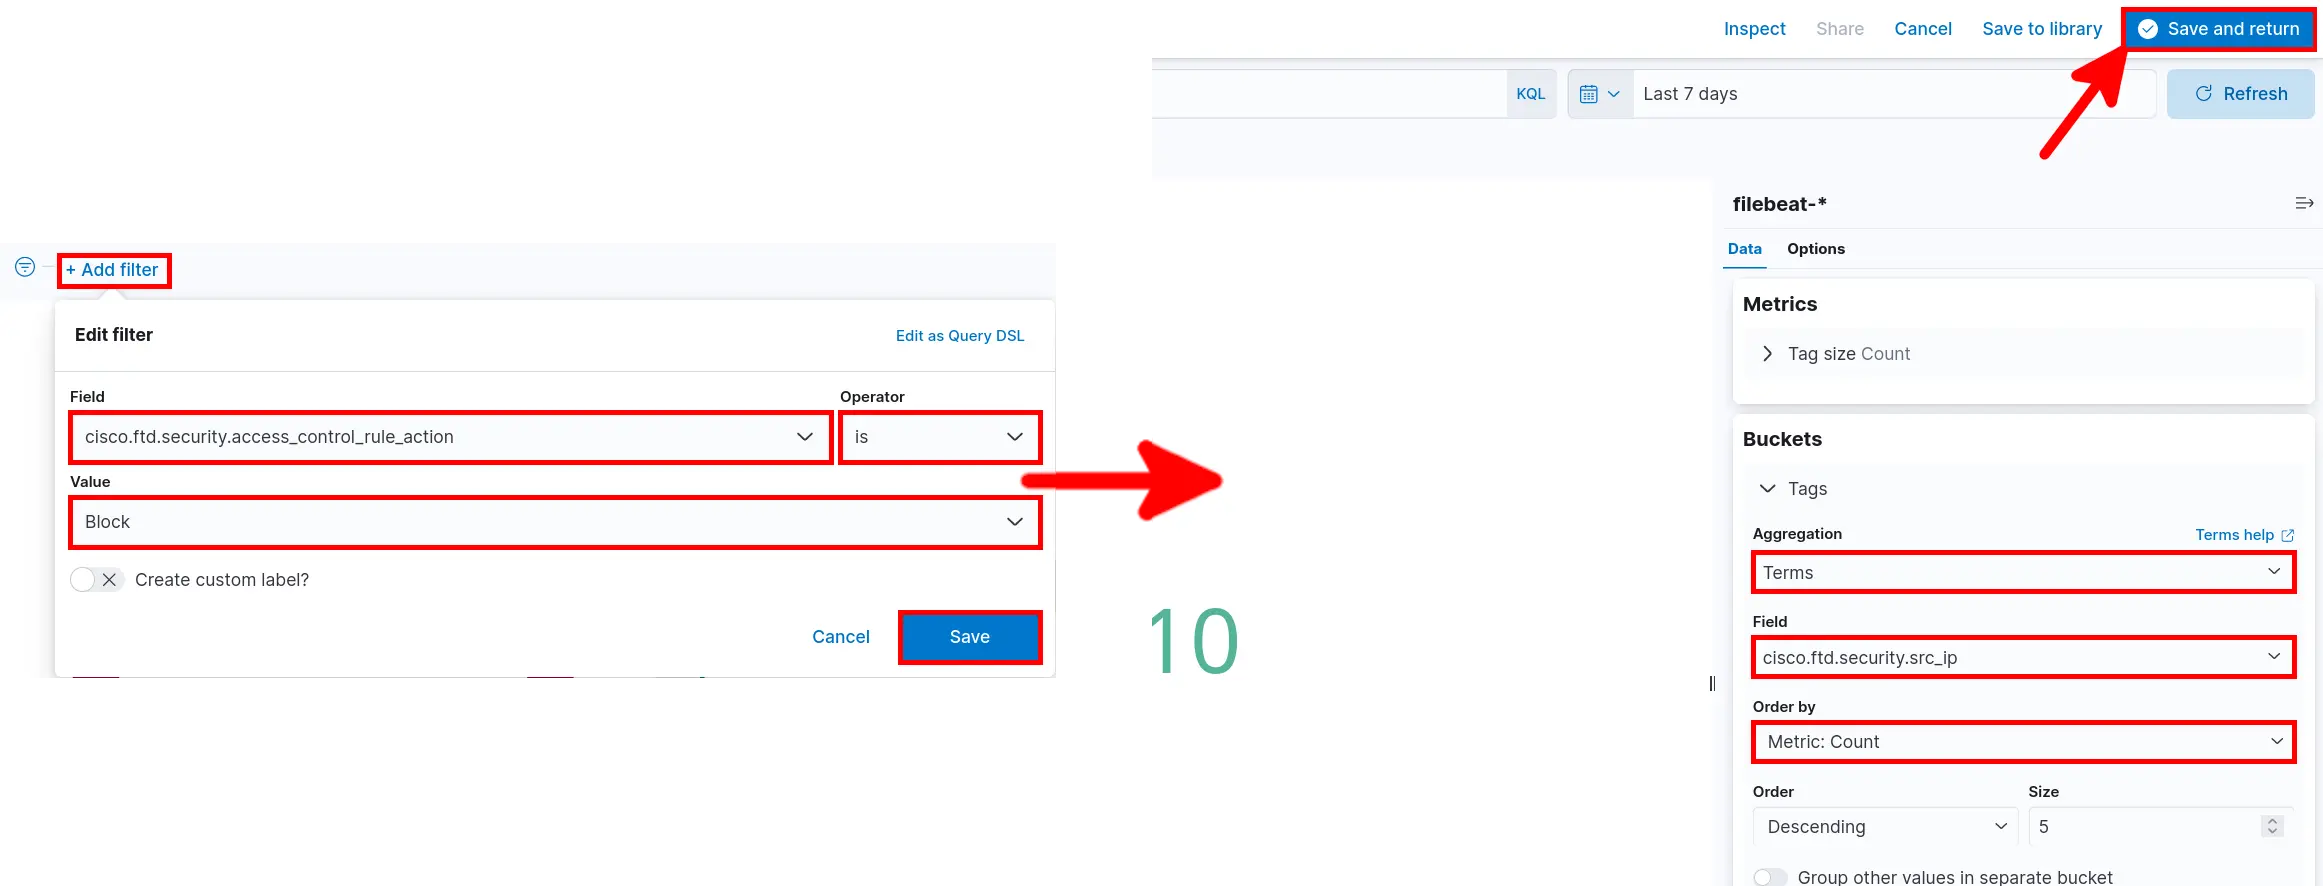
- Click Select type > Aggregation based > Gauge and search for filebeat:
- Add Filter select Aggregation then click Save and return:
Tag cloud
Goal
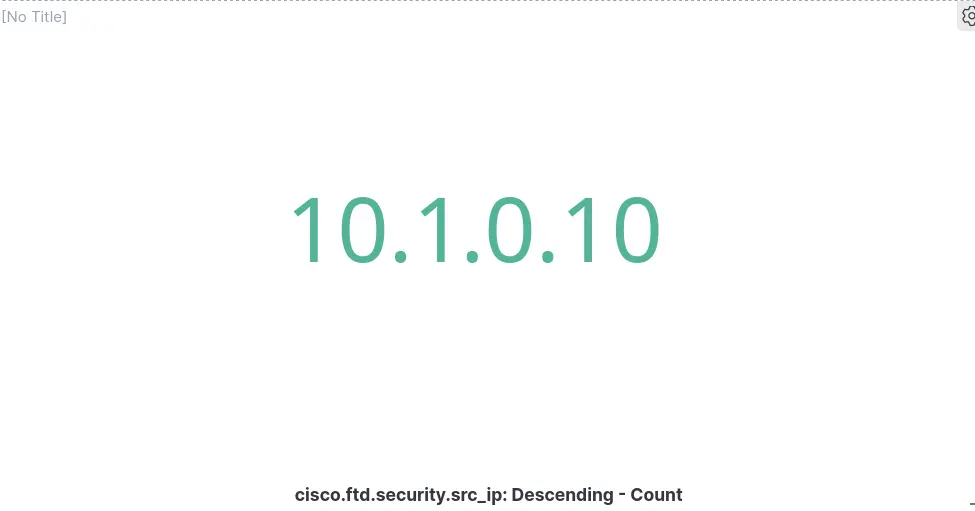
Procedure
- Click Select type > Aggregation based > Tag cloud and search for filebeat:
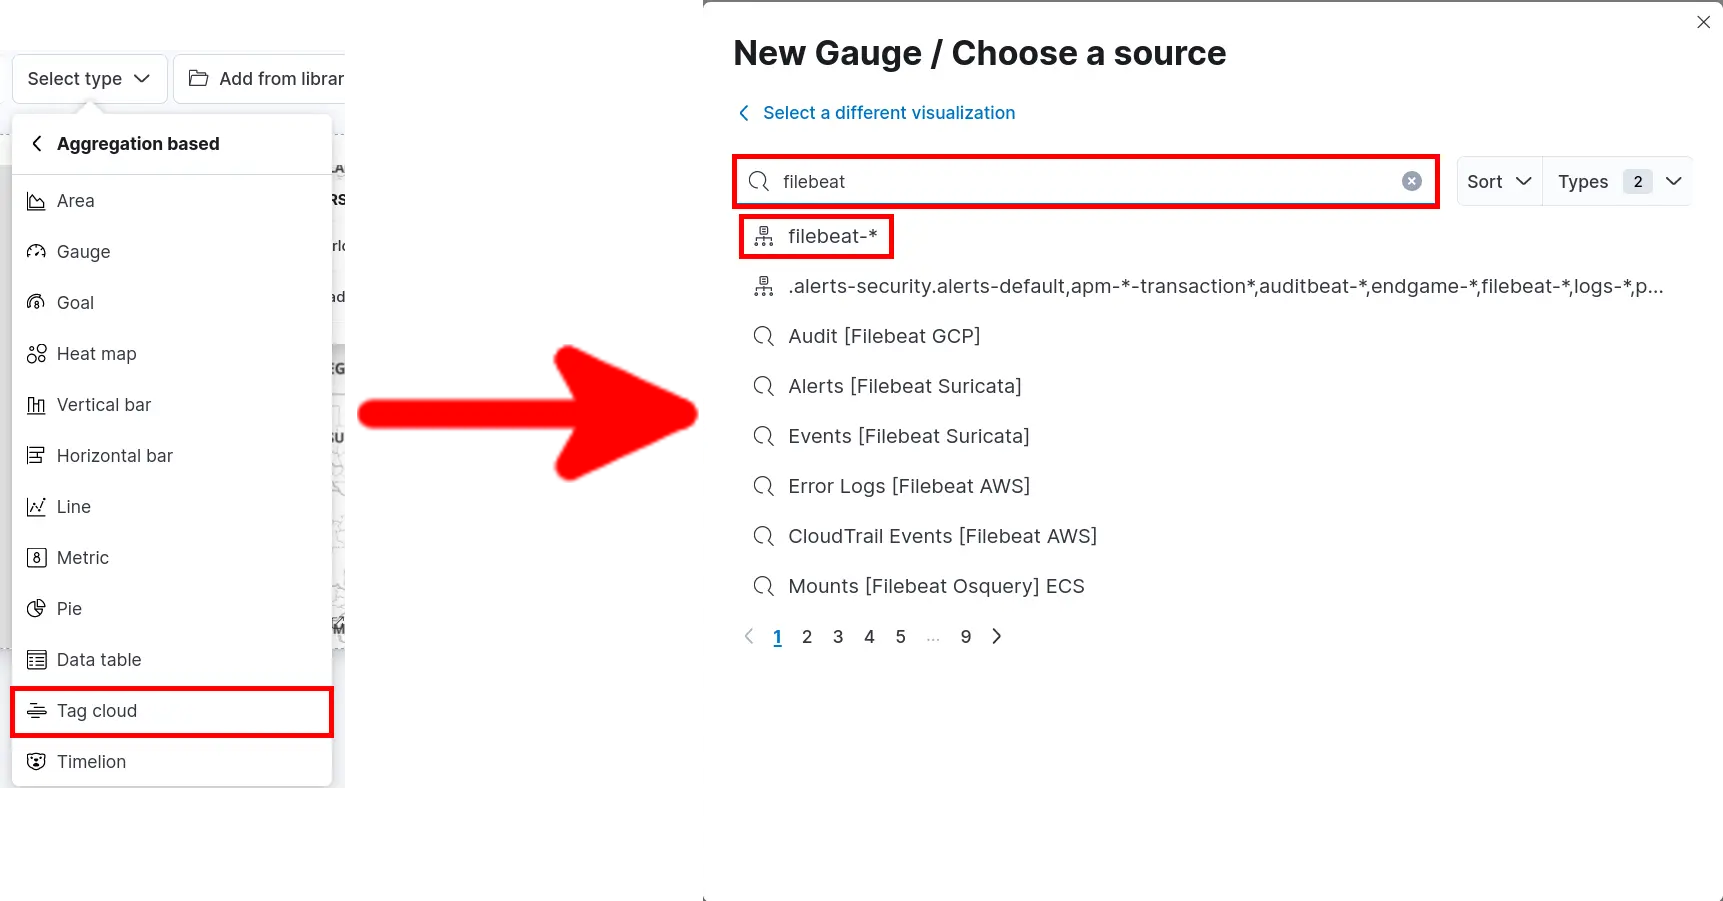
- Add Filter set Aggregation parameters then click Save and return:
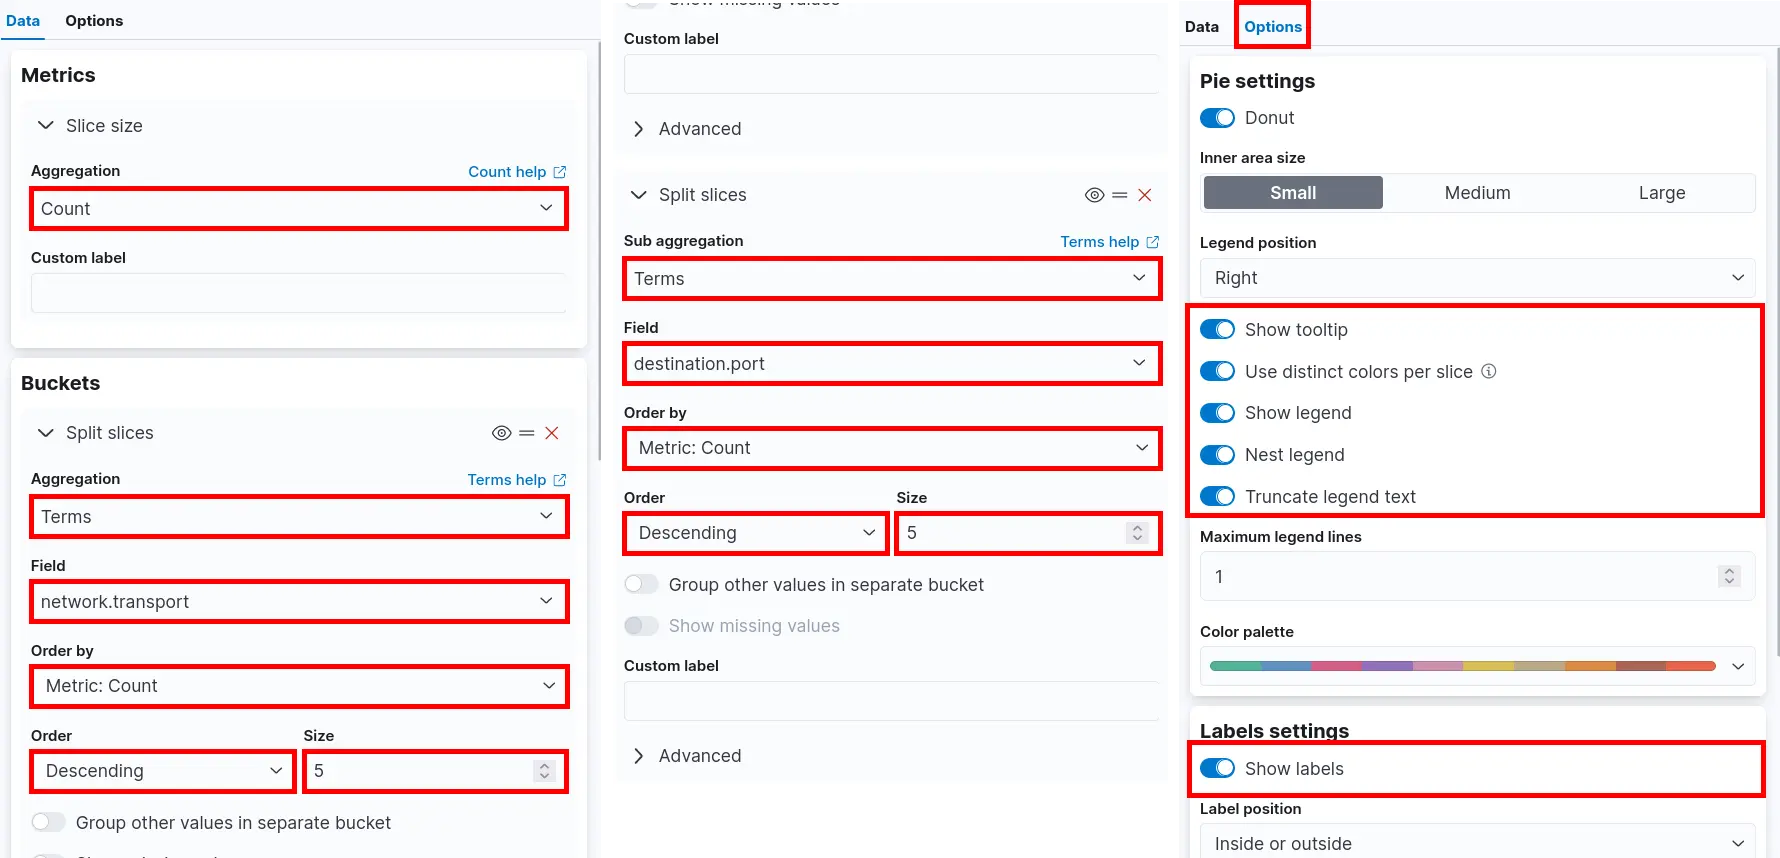
Pie
Goal
Procedure
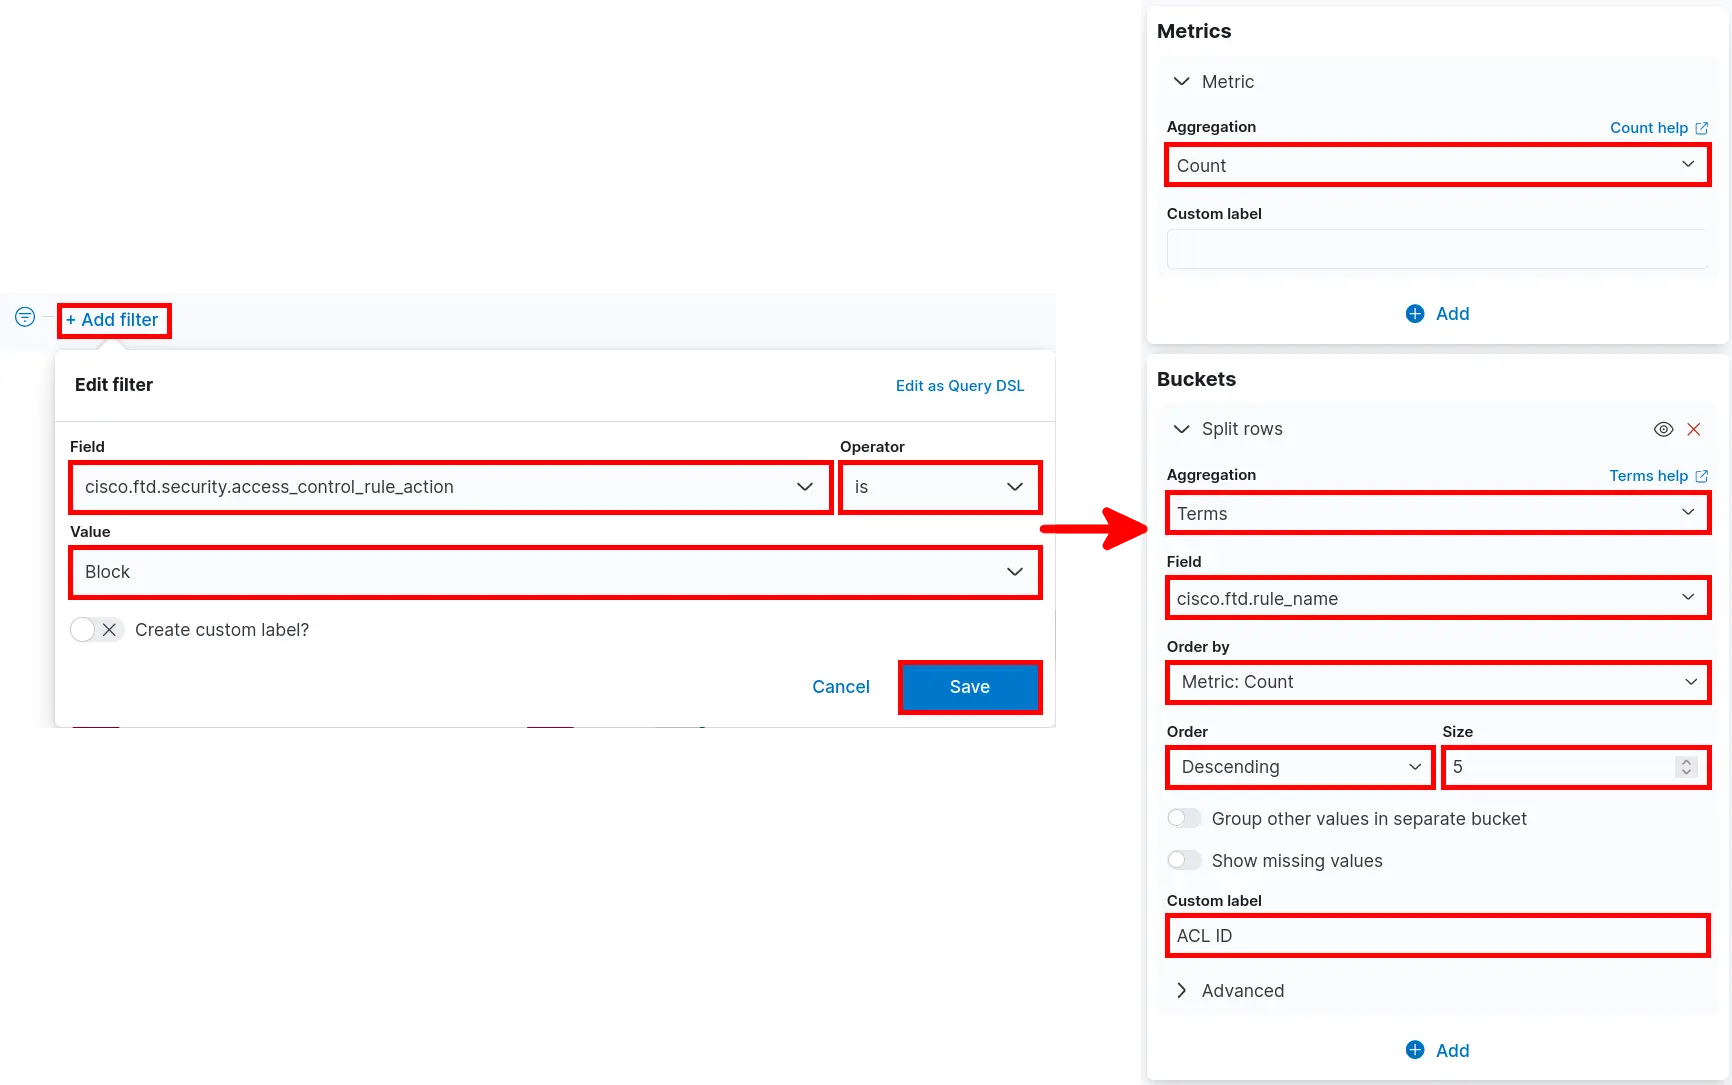
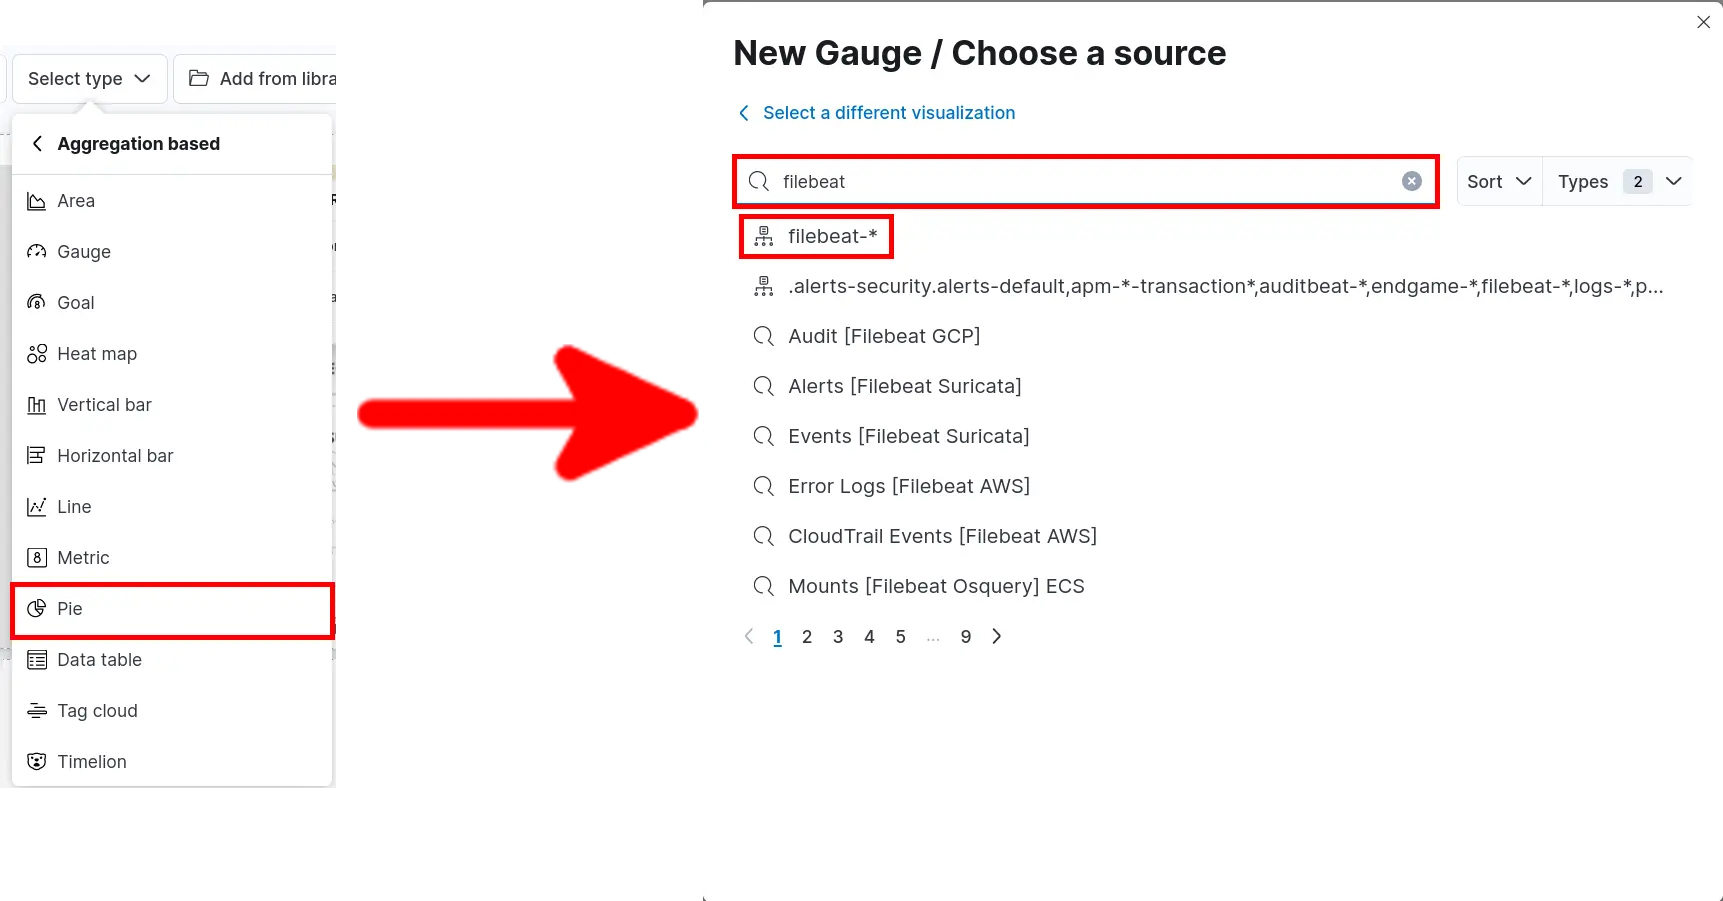
- Click Select type > Aggregation based > Pie and search for filebeat:
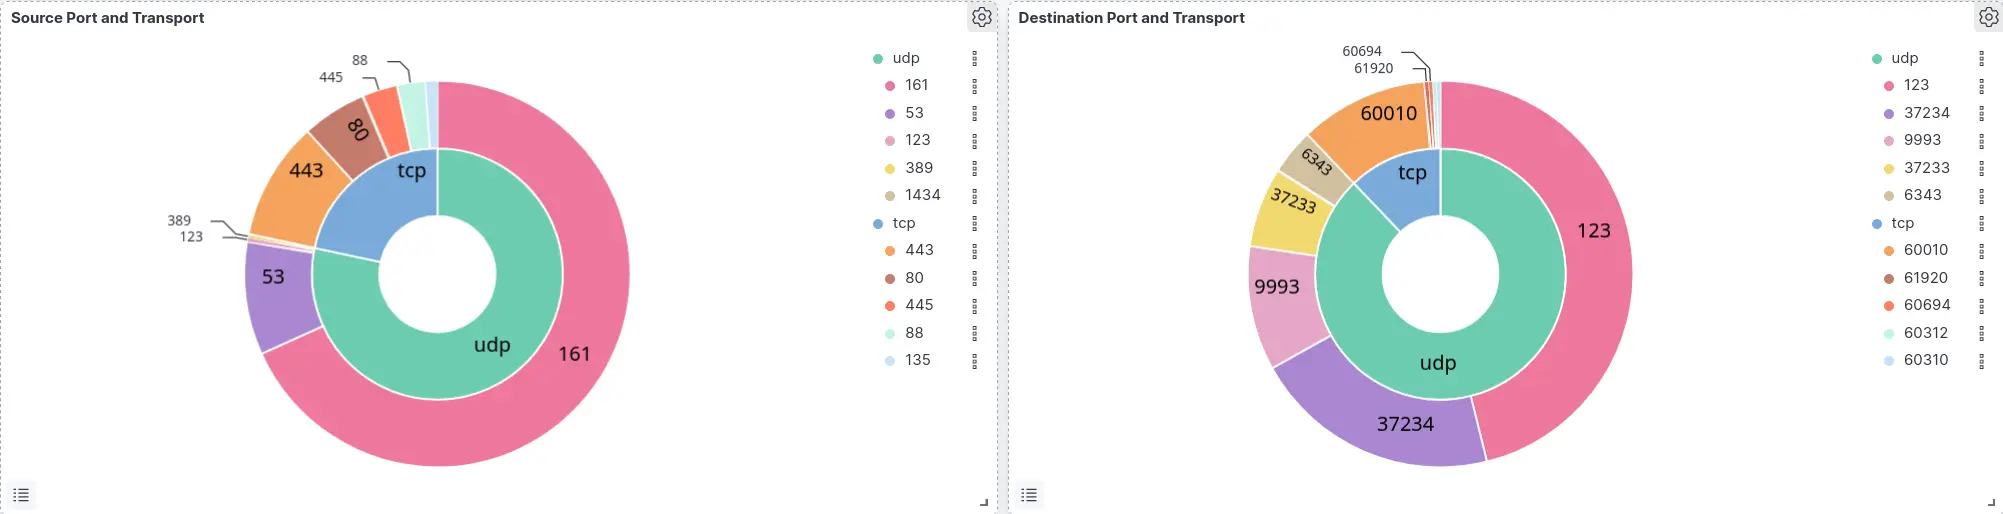
Source Port and Transport
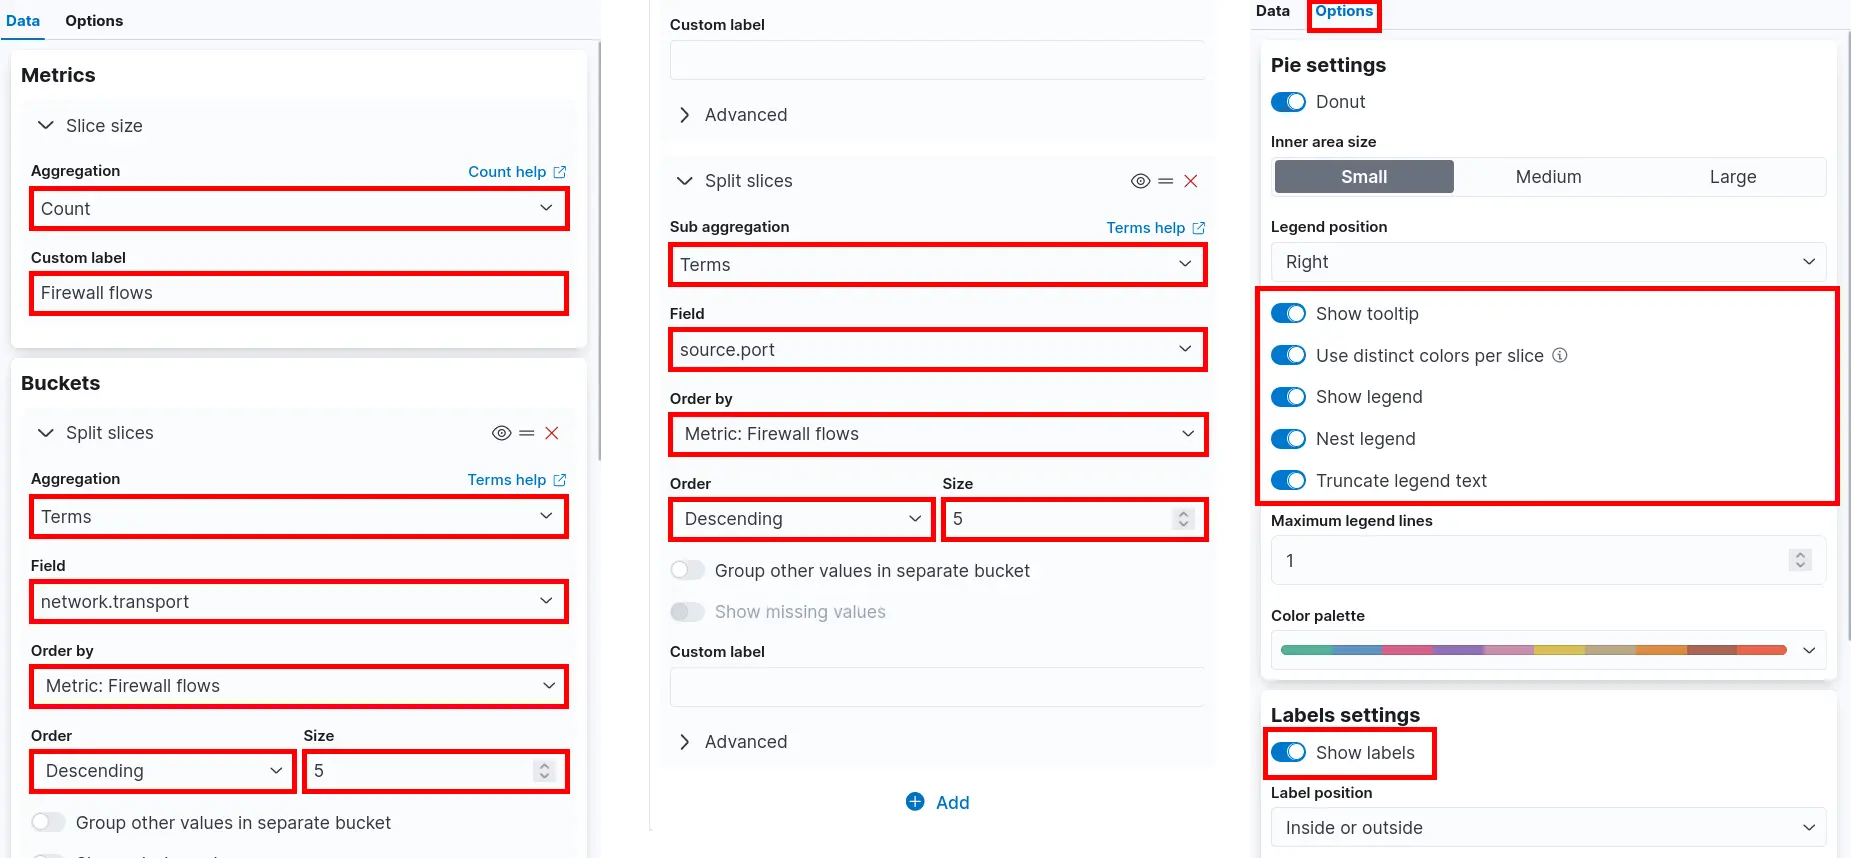
- Set Metrics and Buckets parameters then click Save and return:
Destination Port and Transport
- Set Metrics and Buckets parameters then click Save and return:
Data table
Goal
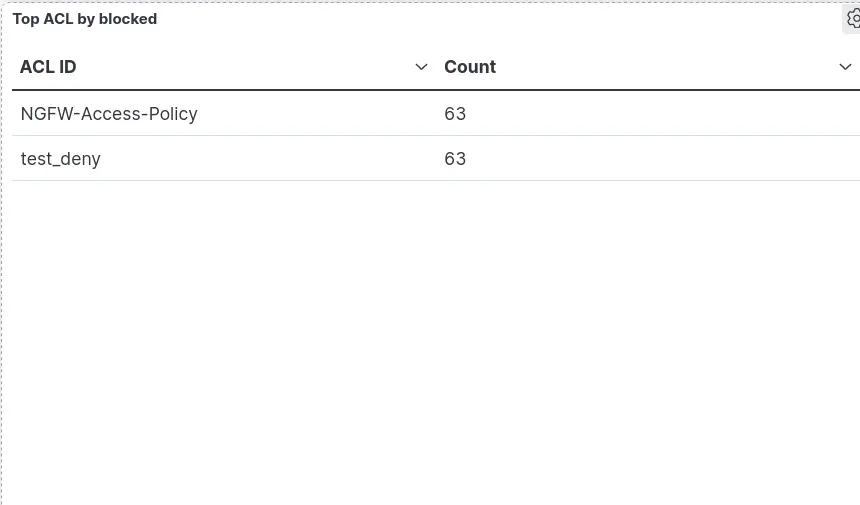
Procedure
- Click Select type > Aggregation based > Data table and search for filebeat:
- Add Filter set Metrics and Buckets parameters then click Save and return: