Elastic Stack 8 - Metricbeat to monitor hardware usage
- Last updated: Oct 14, 2024

We have previously seen how to install Elastic Stack Part I and now we will see how to monitor hardware usage with Metricbeat.
This module will allow us to monitor CPU, memory, Inbound/Outbound traffic and disk utilization with graphical views.
So let's see how to install it on Windows and GNU/Linux systems.
Metricbeat Architecture

Installing Metricbeat
I'll install Metricbeat on every machines I want to monitor in Elasticsearch.
Windows

Download Metricbeat
- Connect to official website and download zip package:
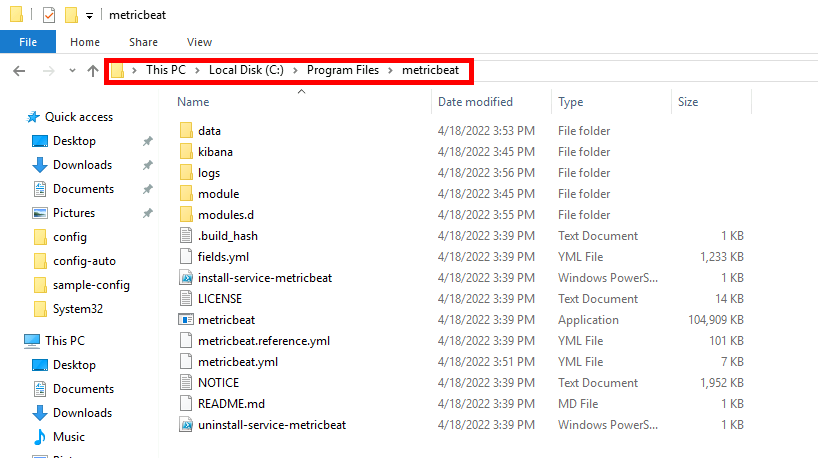
- Once downloaded, unzip the file to
C:\Program Files\metricbeat:
- Edit
metricbeat.ymland replace “X.X.X.X” address by your own Elasticsearch server address and “elastic_password;)” with the elastic user account password:
# =================================== Kibana ===================================

# Starting with Beats version 6.0.0, the dashboards are loaded via the Kibana API.
# This requires a Kibana endpoint configuration.
setup.kibana:

  # Kibana Host
  # Scheme and port can be left out and will be set to the default (http and 5601)
  # In case you specify and additional path, the scheme is required: http://localhost:5601/path
  # IPv6 addresses should always be defined as: https://[2001:db8::1]:5601
  host: "https://X.X.X.X:5601"
  ssl.verification_mode: none
  username: "elastic"
  password: "elastic_password;)"

# ---------------------------- Elasticsearch Output ----------------------------
output.elasticsearch:
  # Array of hosts to connect to.
  hosts: ["X.X.X.X:9200"]

  # Protocol - either `http` (default) or `https`.
  protocol: "https"
  ssl.verification_mode: none

  # Authentication credentials - either API key or username/password.
  #api_key: "id:api_key"
  username: "elastic"
  password: "elastic_password;)"
Install Metricbeat
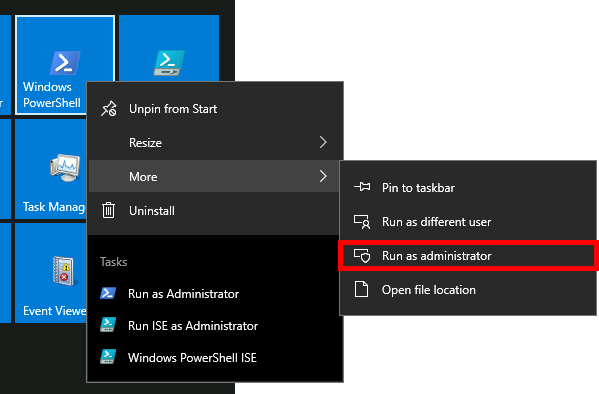
- Open PowerShell command with administrator rights:
- Go to
C:\Program Files\metricbeatdirectory:
PS C:\> cd "C:\Program Files\metricbeat"- Check
metricbeat.ymlfile:
PS C:\> .\metricbeat.exe test config -c .\metricbeat.yml- Install Metricbeat service:
PS C:\> powershell -executionpolicy Unrestricted -file .\install-service-metricbeat.ps1- Set up predefined assets for parsing, indexing, and visualizing:
PS C:\> .\metricbeat.exe setup -e- Start Metricbeat service:
PS C:\> Start-Service metricbeatEnable disk I/O monitoring (Optional)
As with memory or the processor, disk performance can be the source of system slowdown. It is therefore an element to be monitored. This is done by measuring I/O (which gives us the read and write rate). In metricbeat's default configuration, the module that enables this measurement is disabled. I'll explain below how to enable the diskio module.
- Edit the
C:\Program Files\metricbeat\modules.d\system.ymlfile and simply uncomment the linediskio:
# Module: system
# Docs: https://www.elastic.co/guide/en/beats/metricbeat/8.15/metricbeat-module-system.html

- module: system
  period: 10s
  metricsets:
    - cpu
    #- load
    - memory
    - network
    - process
    - process_summary
    - socket_summary
    #- entropy
    #- core
    - diskio
    #- socket
    #- service
#- users- Then restart the metricbeat service for the changes to take effect:
PS C:\> Restart-Service metricbeatGNU/Linux

Install Metricbeat
- Install apt-transport-https and prerequisites packages:
root@host:~# apt update && apt-get install apt-transport-https gnupg curl wget- Import the Elasticsearch PGP key:
root@host:~# wget -qO - https://artifacts.elastic.co/GPG-KEY-elasticsearch | gpg --dearmor -o /usr/share/keyrings/elasticsearch-keyring.gpg- Save the repository definition:
root@host:~# echo "deb [signed-by=/usr/share/keyrings/elasticsearch-keyring.gpg] https://artifacts.elastic.co/packages/8.x/apt stable main" | tee /etc/apt/sources.list.d/elastic-8.x.list- Install Metricbeat package:
root@host:~# apt update && apt-get install metricbeat/etc/metricbeat/metricbeat.yml
# =================================== Kibana ===================================

# Starting with Beats version 6.0.0, the dashboards are loaded via the Kibana API.
# This requires a Kibana endpoint configuration.
setup.kibana:

  # Kibana Host
  # Scheme and port can be left out and will be set to the default (http and 5601)
  # In case you specify and additional path, the scheme is required: http://localhost:5601/path
  # IPv6 addresses should always be defined as: https://[2001:db8::1]:5601
  host: "https://X.X.X.X:5601"
  ssl.verification_mode: none
  username: "elastic"
  password: "elastic_password;)"

# ---------------------------- Elasticsearch Output ----------------------------
output.elasticsearch:
  # Array of hosts to connect to.
  hosts: ["X.X.X.X:9200"]

  # Protocol - either `http` (default) or `https`.
  protocol: "https"
  ssl.verification_mode: none

  # Authentication credentials - either API key or username/password.
  #api_key: "id:api_key"
  username: "elastic"
password: "elastic_password;)"- Start the Metricbeat service:
root@host:~# systemctl start metricbeat- Make it start at boot:
root@host:~# systemctl enable metricbeatEnable disk I/O monitoring (Optional)
- Edit the file
/etc/metricbeat/modules.d/system.ymland as explained in theWindowssection, uncomment the linediskio:
# Module: system
# Docs: https://www.elastic.co/guide/en/beats/metricbeat/main/metricbeat-module-system.html

- module: system
  period: 10s
  metricsets:
    - cpu
    - load
    - memory
    - network
    - process
    - process_summary
    - socket_summary
    #- entropy
    #- core
    - diskio
- Then restart the metricbeat service for the changes to take effect:
root@host:~# systemctl restart metricbeatKibana
Check indices
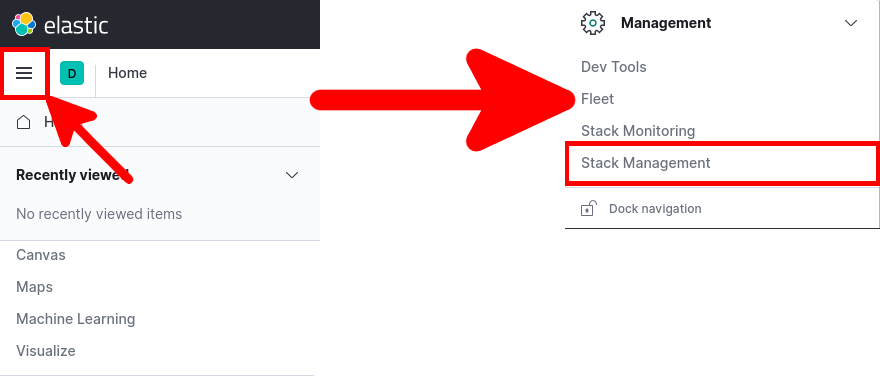
- Open Firefox and go to
https://KIBANA_IP_SERVER:5601/address, then from main menu, go to Management > Stack Management:
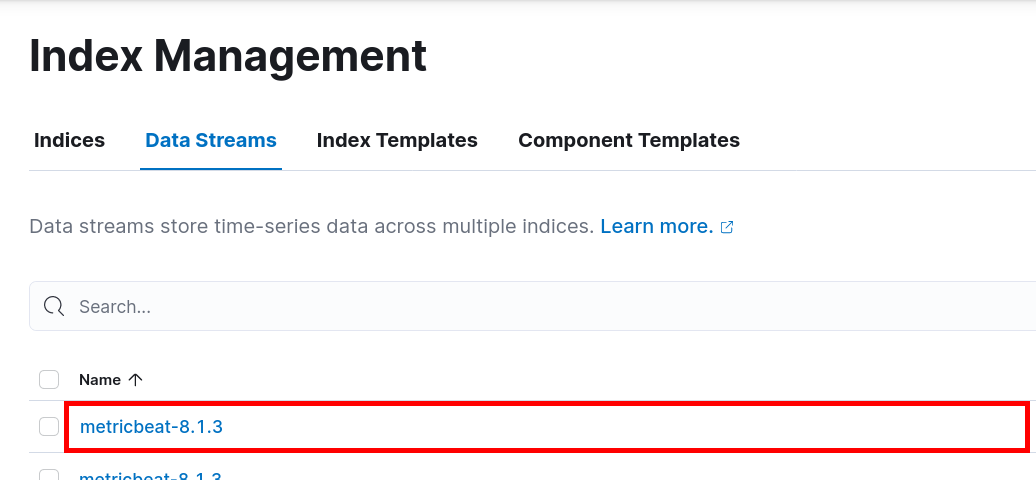
- From Stack Management go to Data > Index Management:
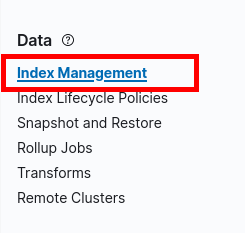
- You should see your indices:
Dashboard
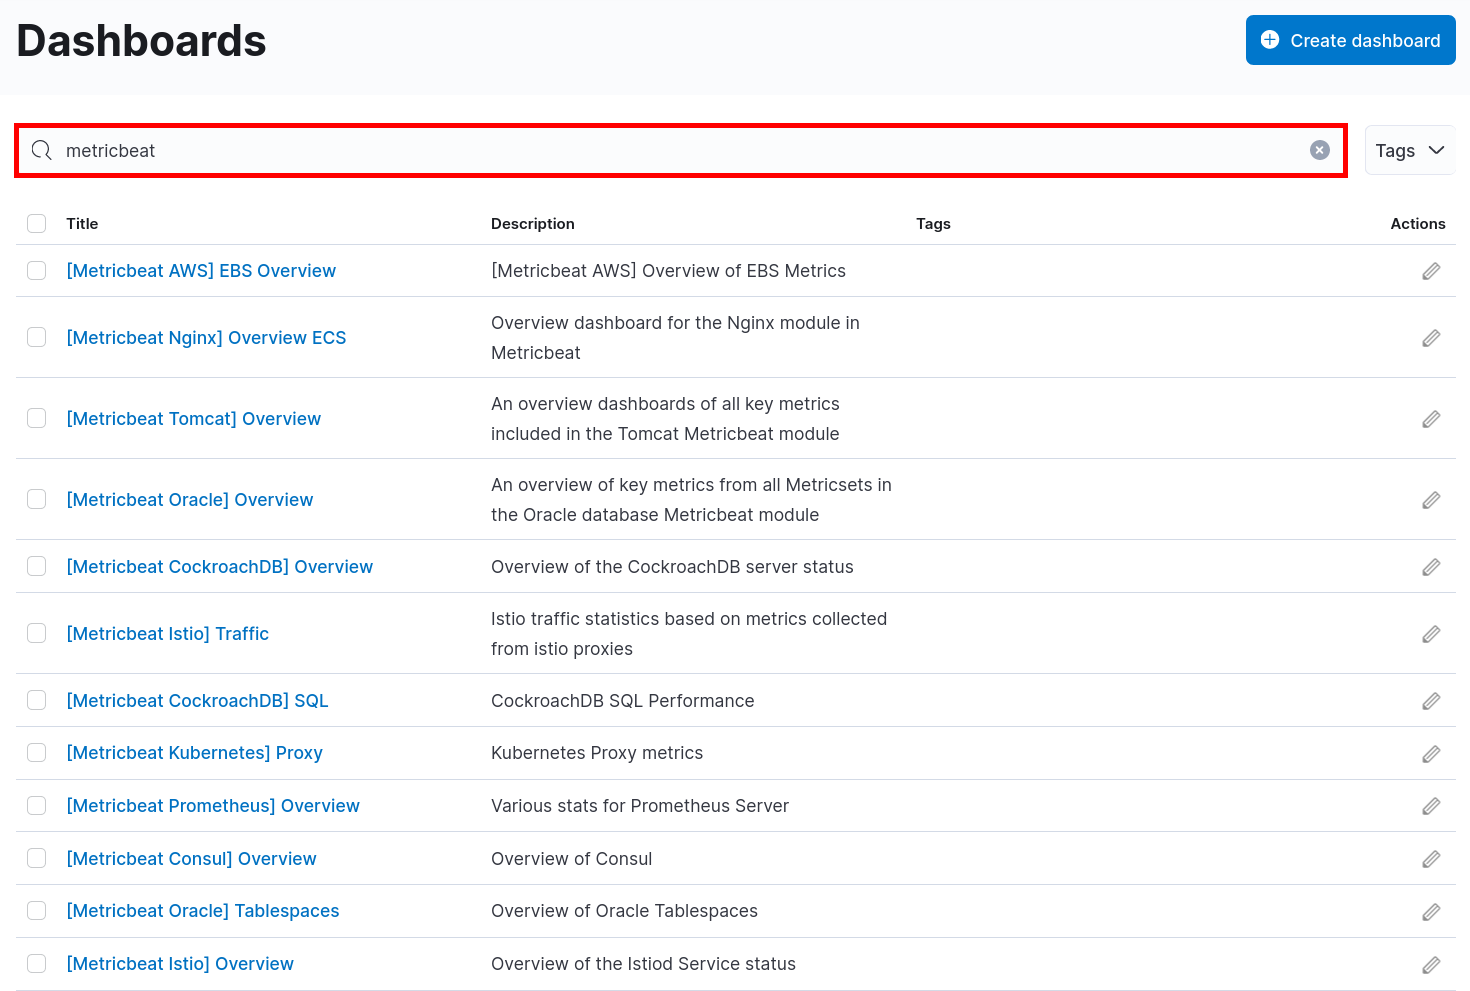
There are a lot of predefined dashboard for Metricbeat we will see how to use them.
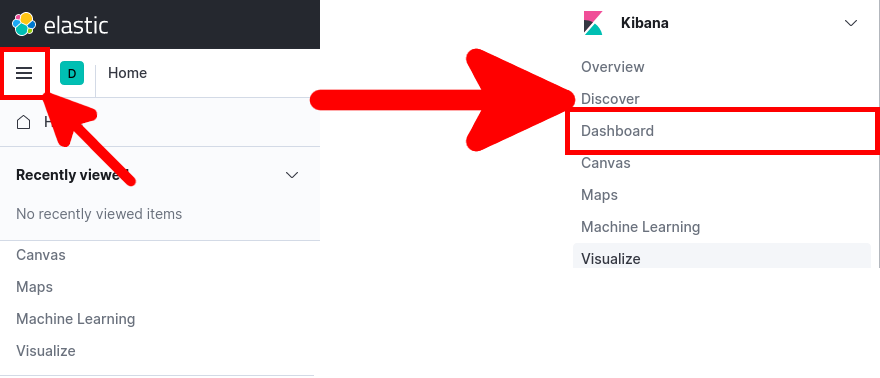
- Open main menu and go to Kibana > Dashboard:
- Type Metricbeat and choose a Dashboard:
- The [Metricbeat System] Overview ECS dashboard:
![Kibana | Metricbeat [Metricbeat System] Overview ECS Dashboard](images/siem/088.png)
- The [Metricbeat System] Host overview ECS dashboard:
![Kibana | Metricbeat [Metricbeat System] Host overview ECS](images/siem/089.png)