Get Mozilla Firefox

We have previously seen how to install Elastic SIEM Part I and how to monitor Cisco Switches (Part II) I will describe here how we can monitor Windows Machines.
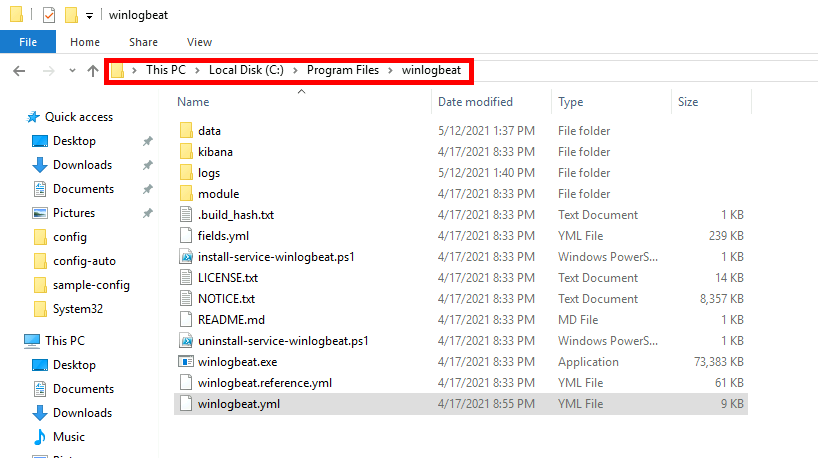
To do so we need to install Winlogbeat module on every Windows stations we want to monitor.
Winlogbeat works as an agent which collects informations on Windows then send it back to Elasticsearch server.

I'll install Winlogbeat on every machines we want to monitor in Elasticsearch.
# =================================== Kibana ===================================

# Starting with Beats version 6.0.0, the dashboards are loaded via the Kibana API.
# This requires a Kibana endpoint configuration.
setup.kibana:

  # Kibana Host
  # Scheme and port can be left out and will be set to the default (http and 5601)
  # In case you specify and additional path, the scheme is required: http://localhost:5601/path
  # IPv6 addresses should always be defined as: https://[2001:db8::1]:5601
  host: "192.168.1.200:5601"

# ---------------------------- Elasticsearch Output ----------------------------
output.elasticsearch:
  # Array of hosts to connect to.
  hosts: ["192.168.1.200:9200"]
PS C:\> cd "C:\Program Files\winlogbeat"
PS C:\> .\winlogbeat.exe test config -c .\winlogbeat.yml
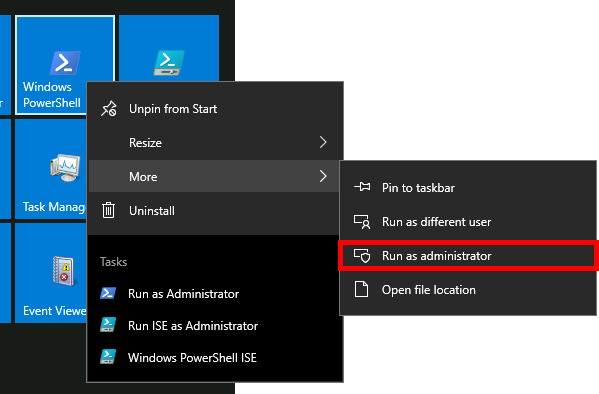
PS C:\> powershell -executionpolicy UnRestricted -file .\install-service-winlogbeat.ps1
PS C:\> .\winlogbeat.exe setup -e
PS C:\> Start-Service winlogbeat
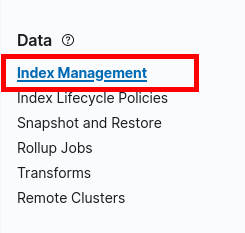
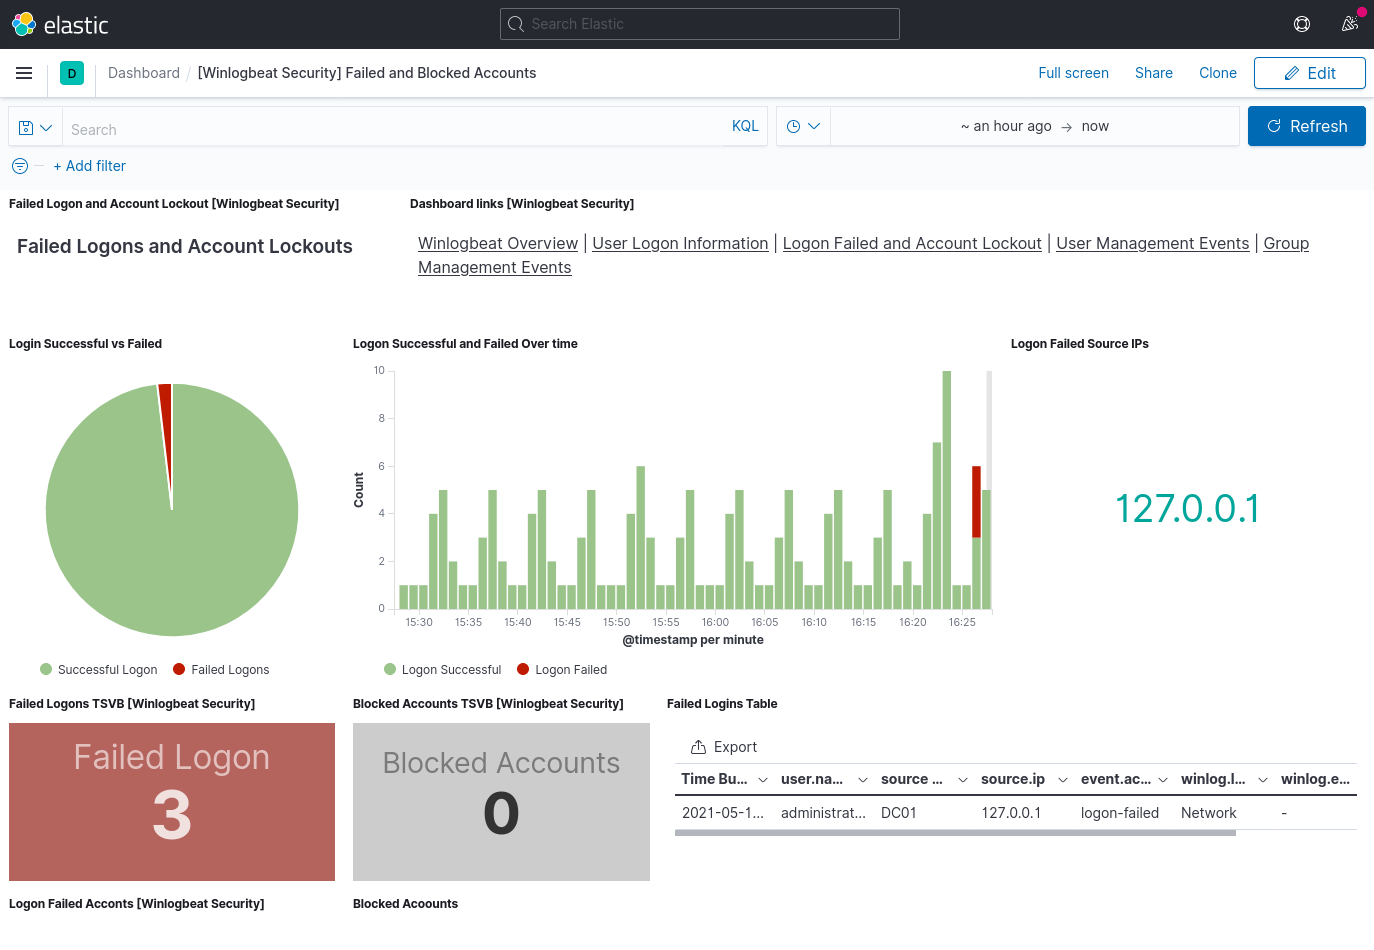
Now that we have our data inside indexes it's time to create a dashboard in kibana to have a graphical view of our swicthes logs.
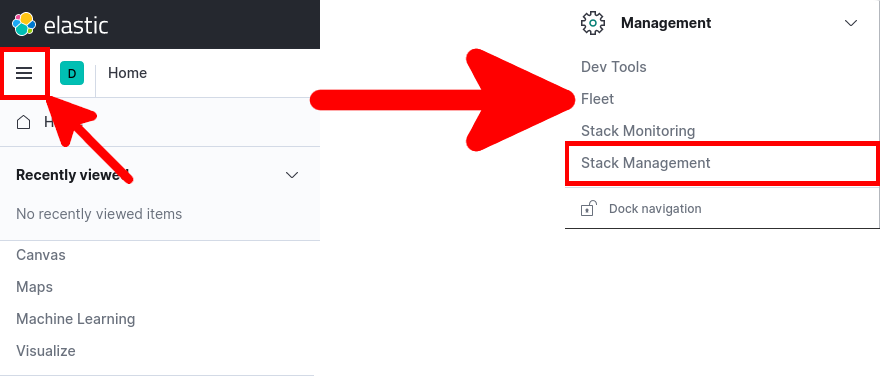
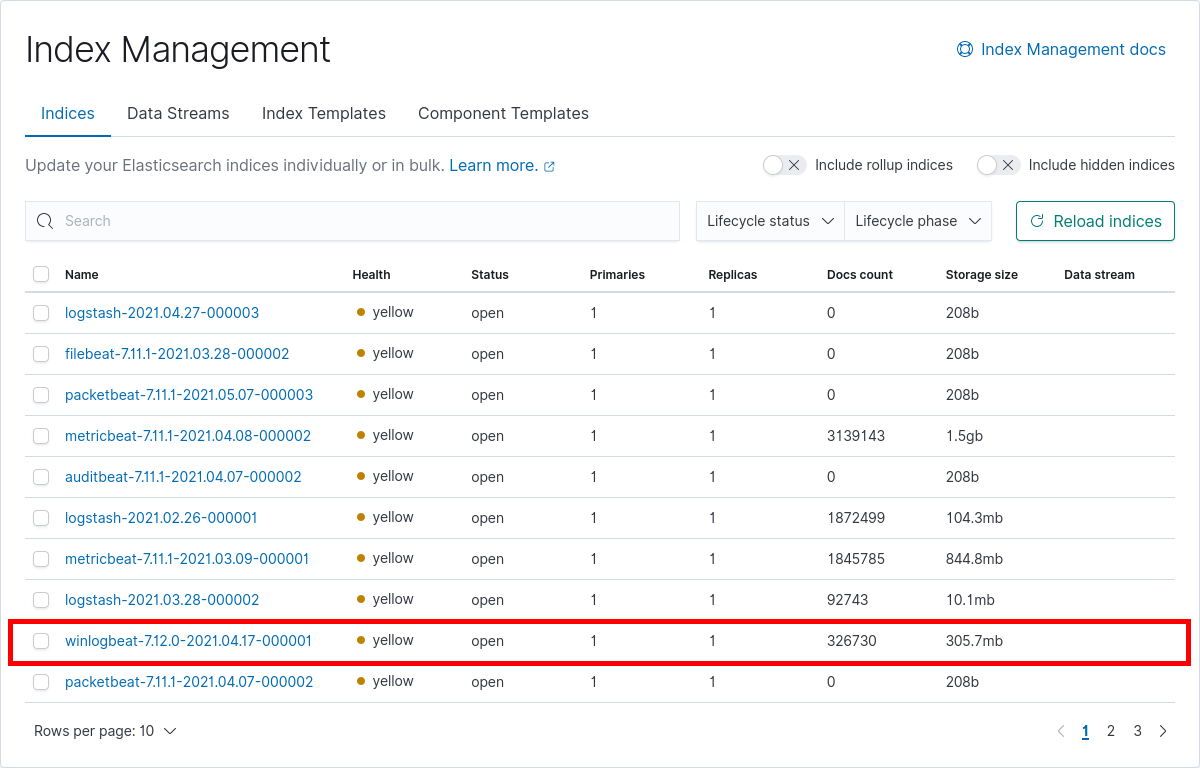
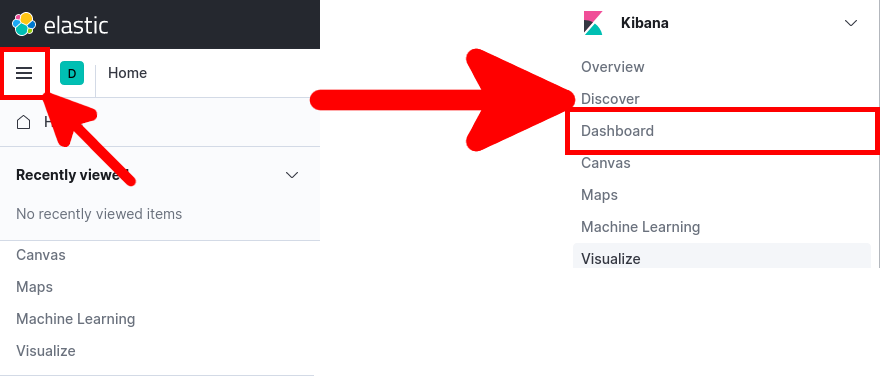
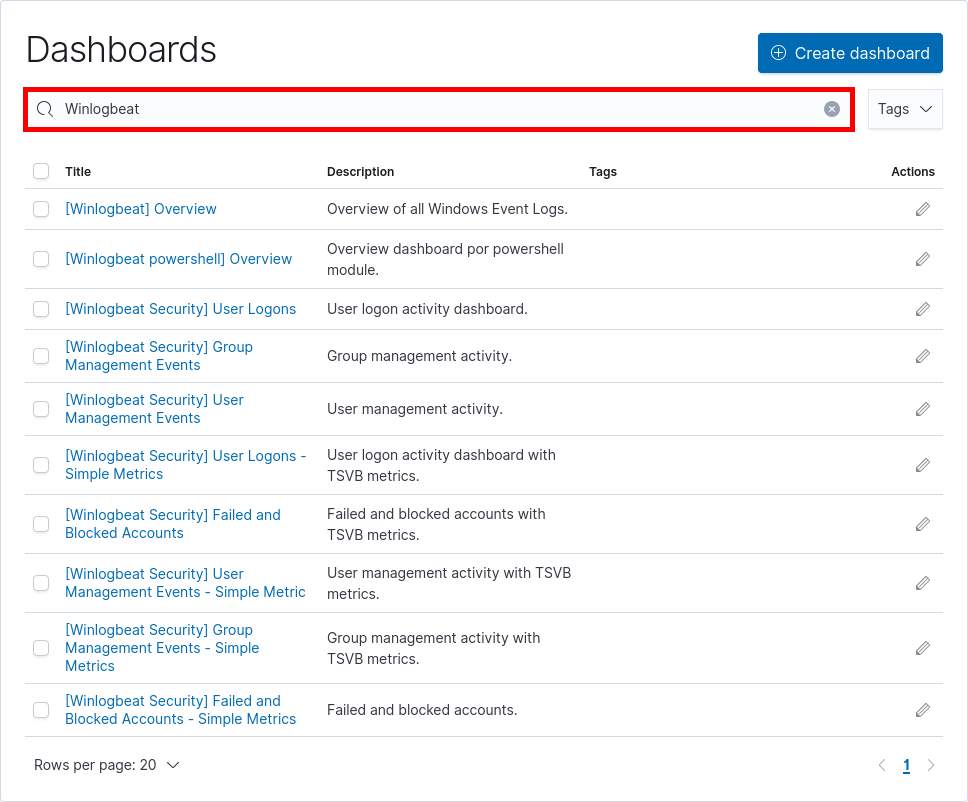
There are a lot of predefined dashboard for winlogbeat we will see how to use them.
Contact :