Elastic Stack 8 - Winlogbeat to monitor Windows Servers
- Last updated: May 1, 2022

We have previously seen how to install Elastic Stack Part I and how to monitor Cisco Switches (Part II) I will describe here how we can monitor Windows Machines.
To do so we need to install Winlogbeat module on every Windows stations we want to monitor.
Winlogbeat works as an agent which collects informations on Windows then send it back to Elasticsearch server.
Thanks to this module we can monitor : users logon activity, failed and blocked accounts, events etc…
Winlogbeat Architecture

Installing Winlogbeat (Windows)
I'll install Winlogbeat on every machines I want to monitor in Elasticsearch.
Download Winlogbeat
- Connect to official website and download zip package:
- Once downloaded, unzip the file to
C:\Program Files\winlogbeat:
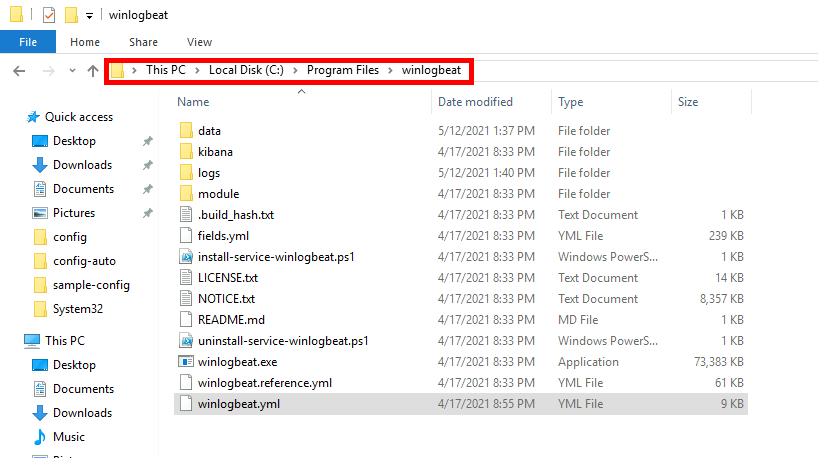
- Edit
winlogbeat.ymland replace X.X.X.X address by your own Elasticsearch server address:
# =================================== Kibana ===================================

# Starting with Beats version 6.0.0, the dashboards are loaded via the Kibana API.
# This requires a Kibana endpoint configuration.
setup.kibana:

  # Kibana Host
  # Scheme and port can be left out and will be set to the default (http and 5601)
  # In case you specify and additional path, the scheme is required: http://localhost:5601/path
  # IPv6 addresses should always be defined as: https://[2001:db8::1]:5601
  host: "https://X.X.X.X:5601"
  ssl.verification_mode: none
  username: "elastic"
  password: "elastic_password;)"

# ---------------------------- Elasticsearch Output ----------------------------
output.elasticsearch:
  # Array of hosts to connect to.
  hosts: ["X.X.X.X:9200"]

  # Protocol - either `http` (default) or `https`.
  protocol: "https"
  ssl.verification_mode: none

  # Authentication credentials - either API key or username/password.
  #api_key: "id:api_key"
  username: "elastic"
  password: "elastic_password;)"
Install Winlogbeat
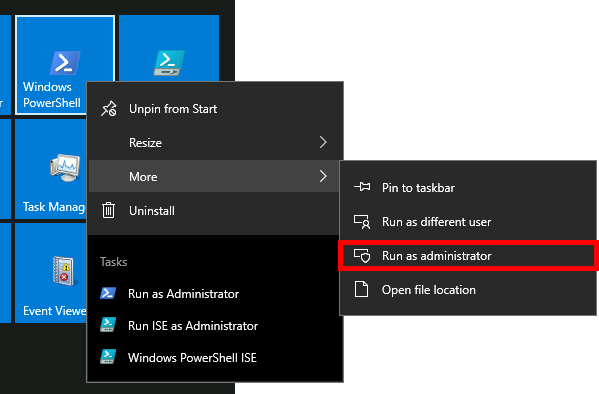
- Open PowerShell command with administrator rights:
- Go to
C:\Program Files\winlogbeatdirectory:
PS C:\> cd "C:\Program Files\winlogbeat"- Check
winlogbeat.ymlfile:
PS C:\> .\winlogbeat.exe test config -c .\winlogbeat.yml- Install Winlogbeat service:
PS C:\> powershell -executionpolicy UnRestricted -file .\install-service-winlogbeat.ps1- Set up predefined assets for parsing, indexing, and visualizing:
PS C:\> .\winlogbeat.exe setup -e- Start Winlogbeat service:
PS C:\> Start-Service winlogbeatKibana
Check indices
- Open Firefox and go to
https://KIBANA_IP_SERVER:5601/address, then from main menu, go to Management > Stack Management:
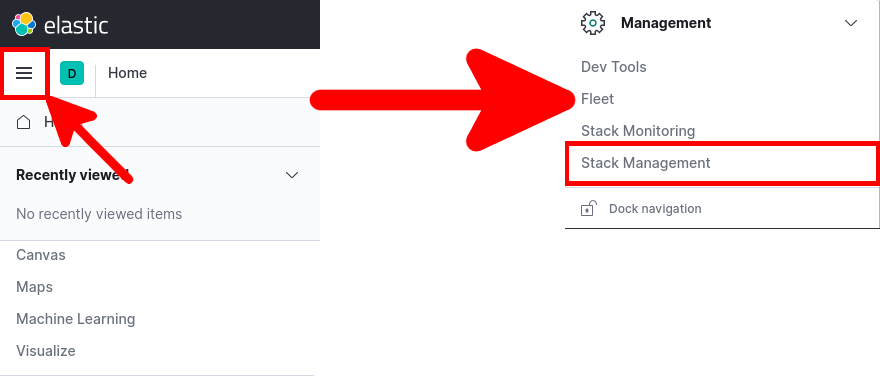
- From Stack Management go to Data > Index Management:
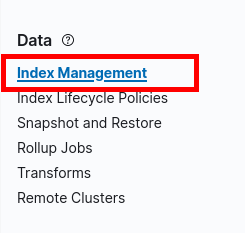
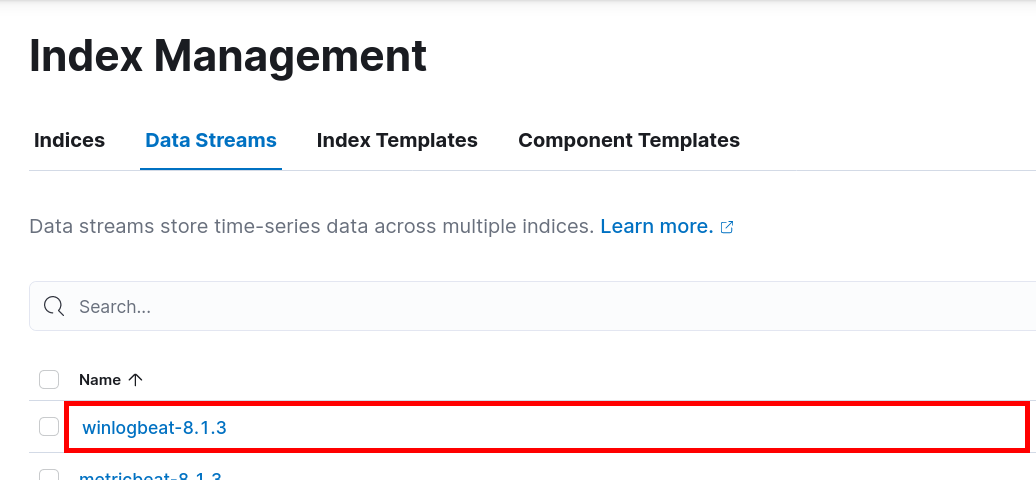
- You should see your indices:
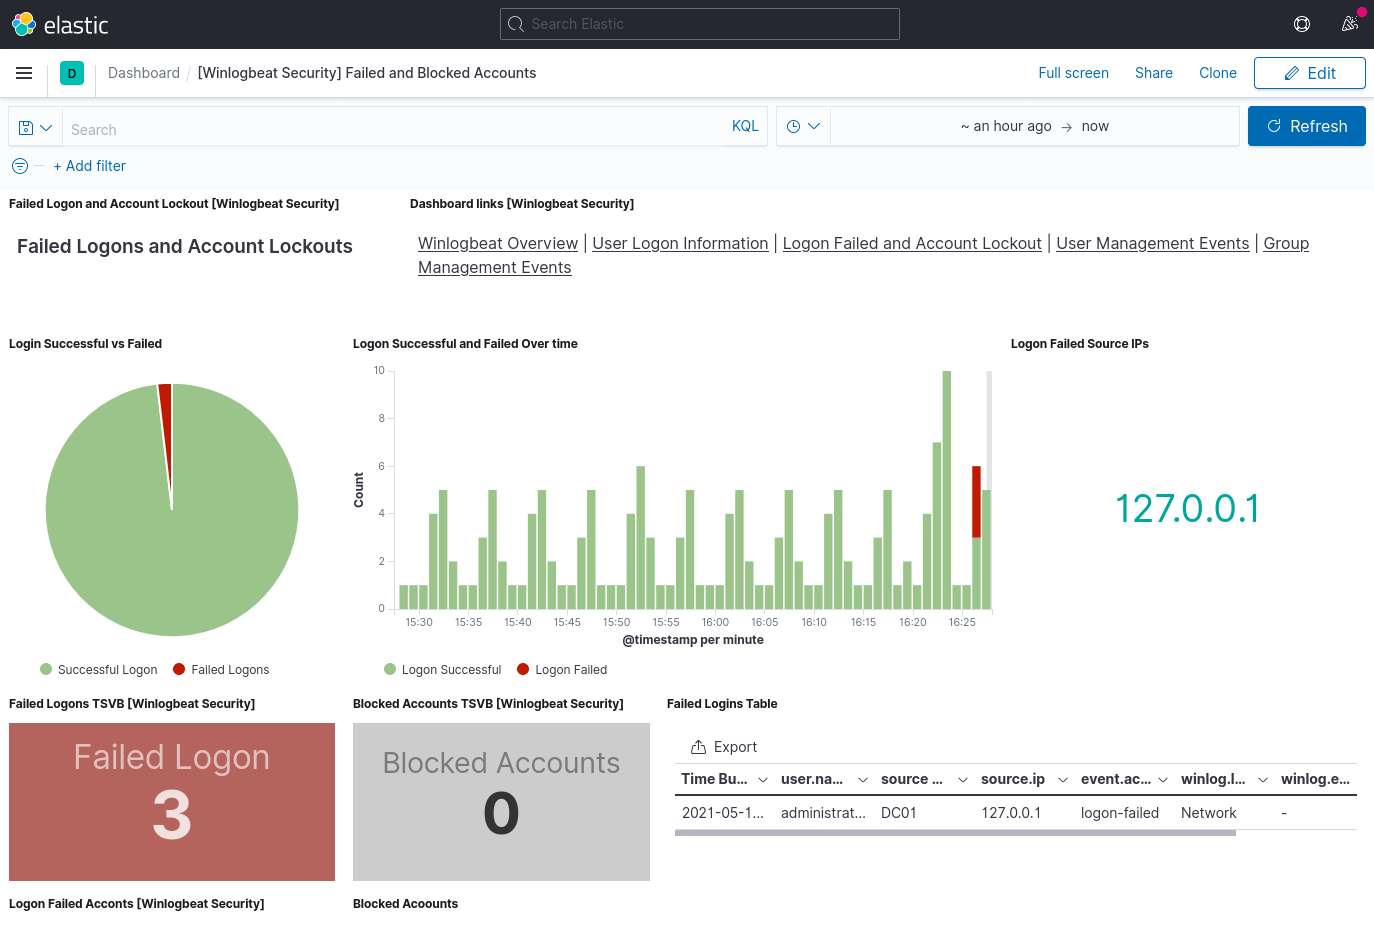
Dashboard
There are a lot of predefined dashboard for winlogbeat we will see how to use them.
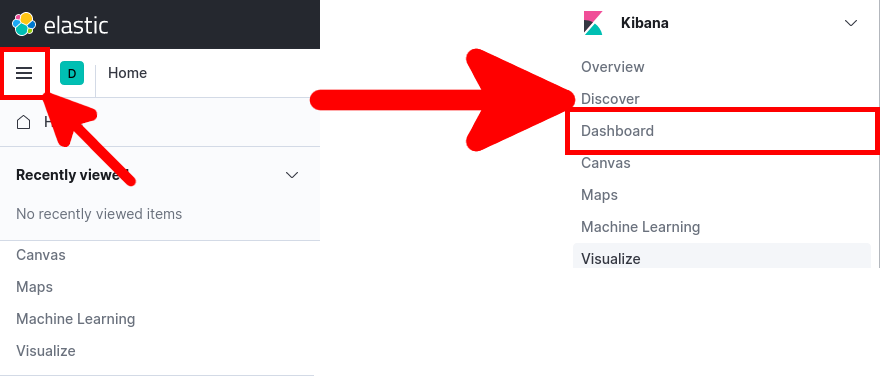
- Open main menu and go to Kibana > Dashboard:
- Type Winlogbeat and choose a Dashboard:
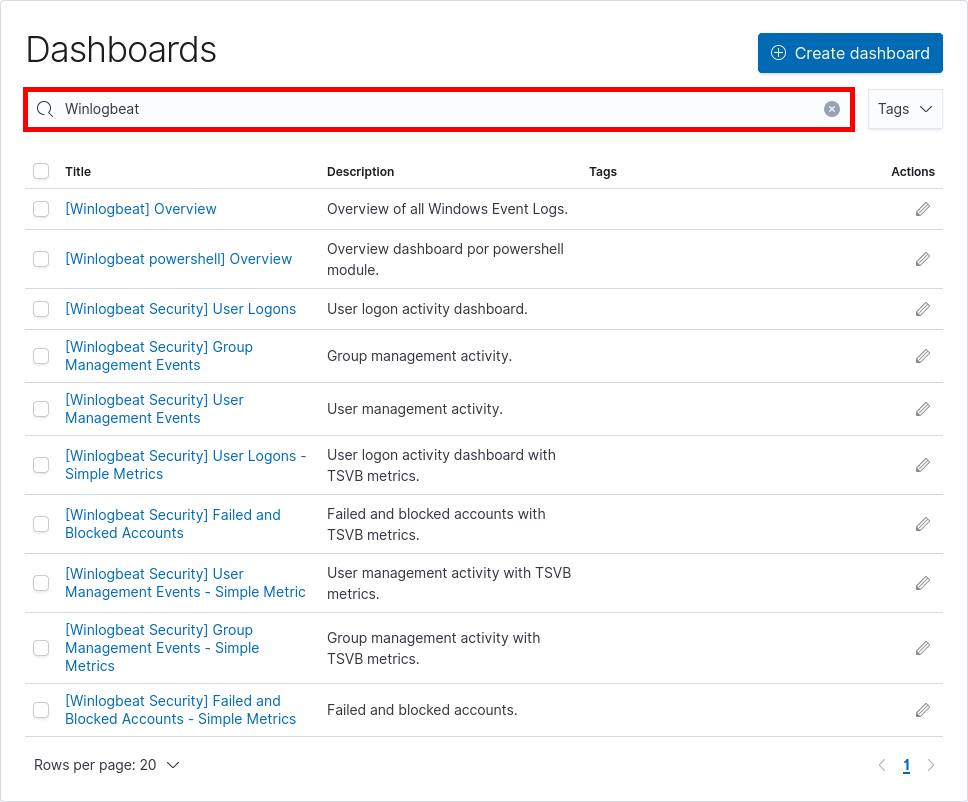
- For example with the Failed and Blocked Account: