
Monitor Cisco Firepower FTD with Elastic Fleet
- Last updated: Jul 12, 2026

This guide assumes that you already have a fully working Elastic Stack with Fleet Server. If needed, you can follow this wonderful 😎 tutorial to install a complete Elastic Stack. In this article, we will see how to monitor a Cisco Firepower FTD firewall with Elastic Fleet, Elastic Agent and Kibana.
In this tutorial, we will install the Cisco FTD integration on the same Debian Linux server where Elasticsearch, Kibana and the Fleet Server are already installed.
Network Architecture
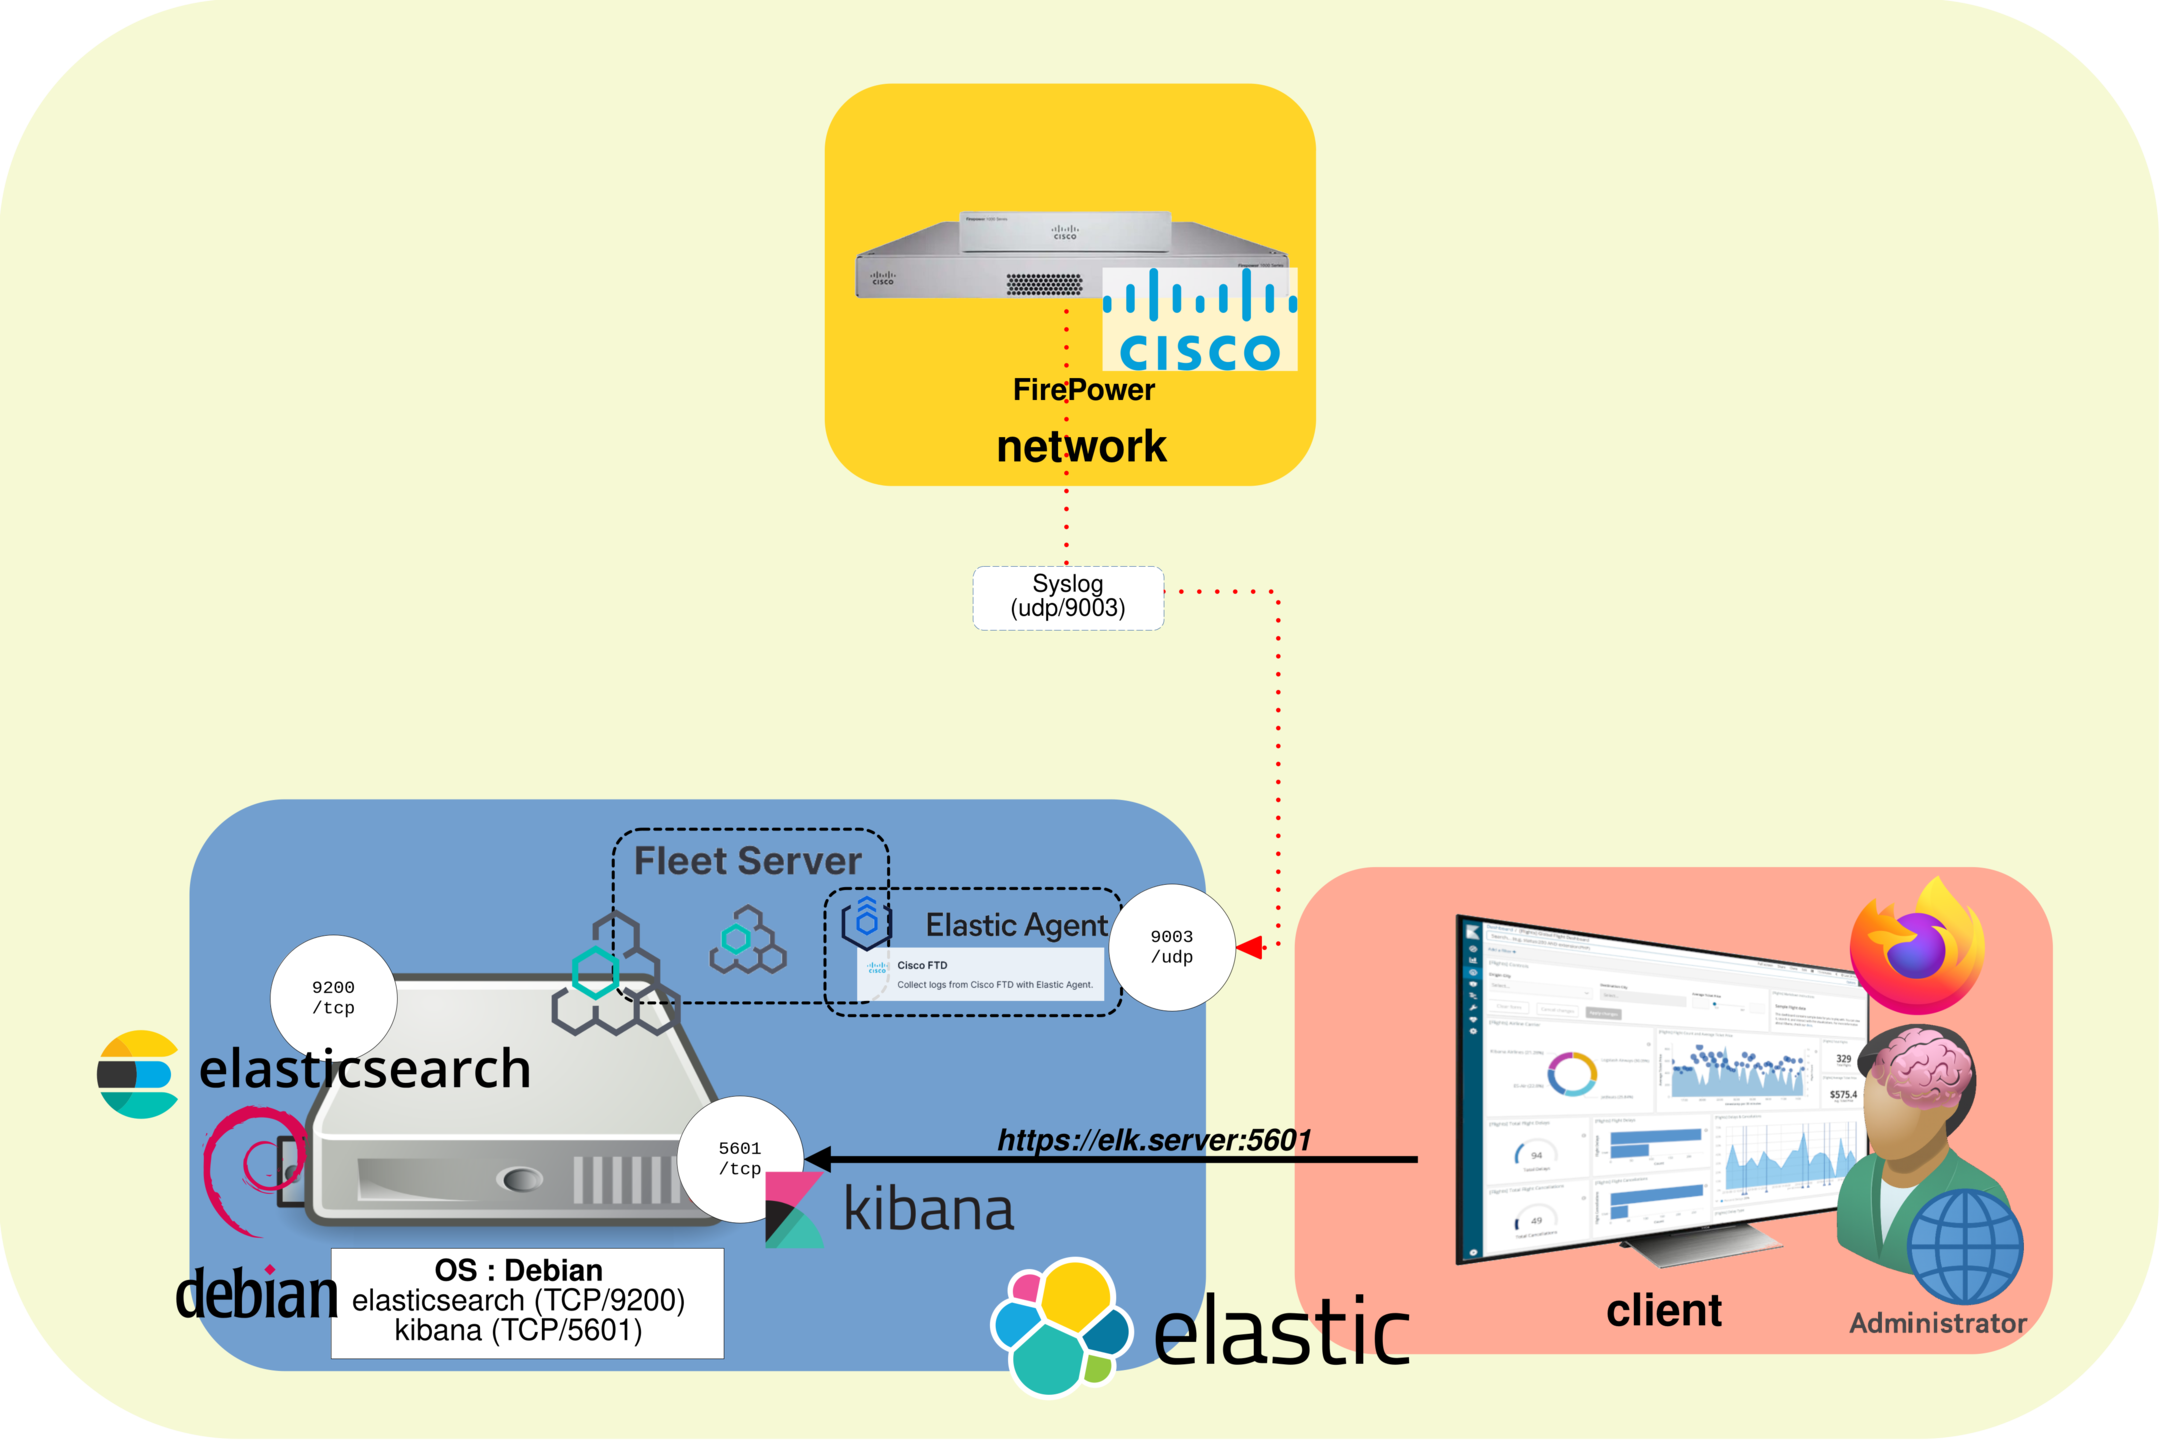
As shown in the network architecture diagram, the Elastic Agent will be installed on the Elasticsearch server. The Cisco Firepower FTD firewall will forward its logs to Elastic Fleet via the Syslog protocol on 9003/udp. This listening port can be changed if needed.
Add Cisco FTD Integration in Kibana
First, open Kibana and add the Cisco FTD integration so that your Elastic Stack can collect and parse logs sent by your Cisco Firepower FTD firewall. However, this integration does not include a prebuilt Kibana dashboard, so we will create our own dashboard later in this guide.
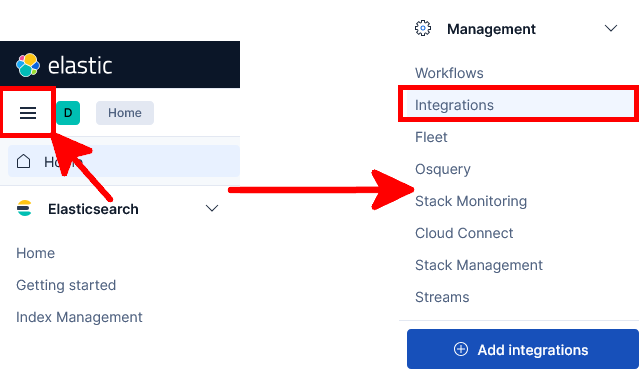
- In Kibana, open the main menu, then go to Management → Integrations:
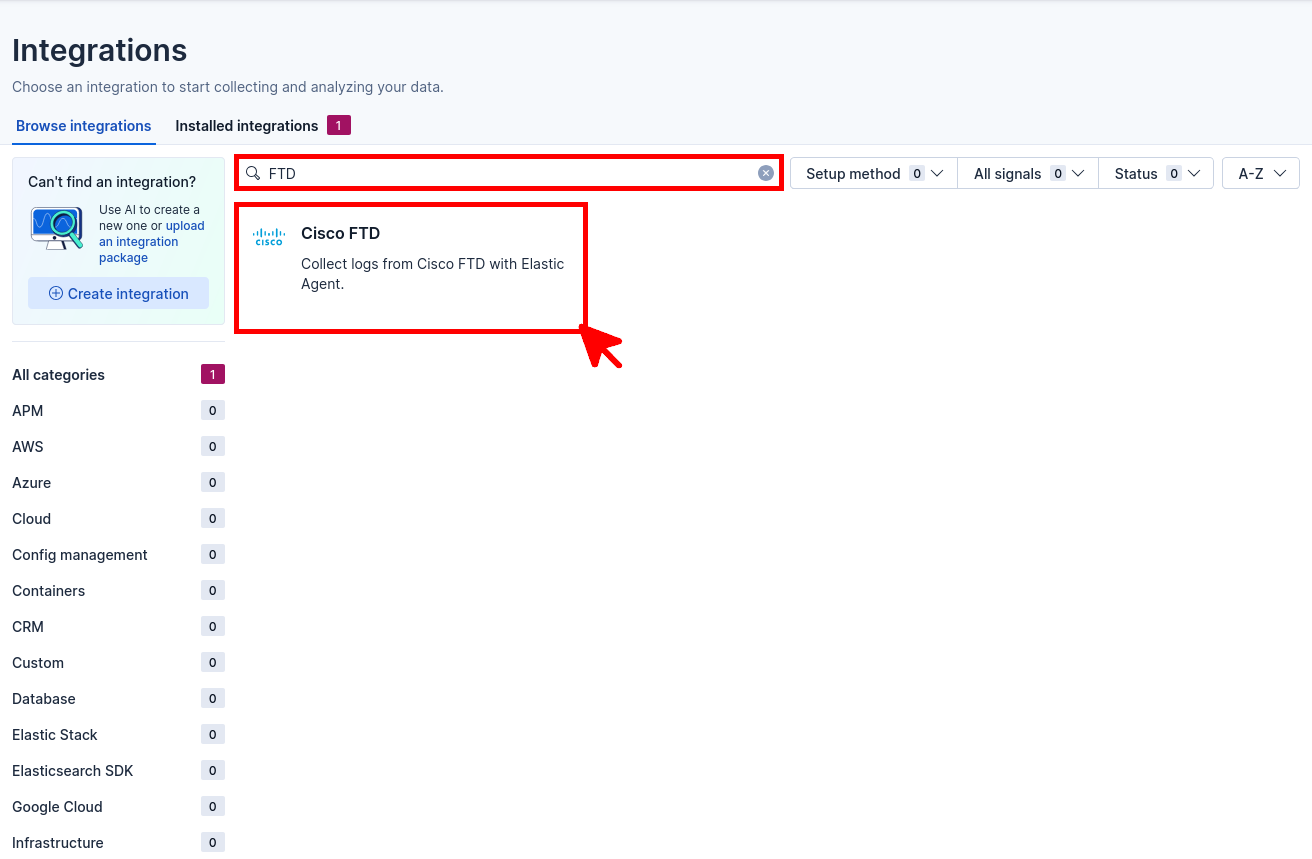
- Search for FTD, then click the Cisco FTD integration:
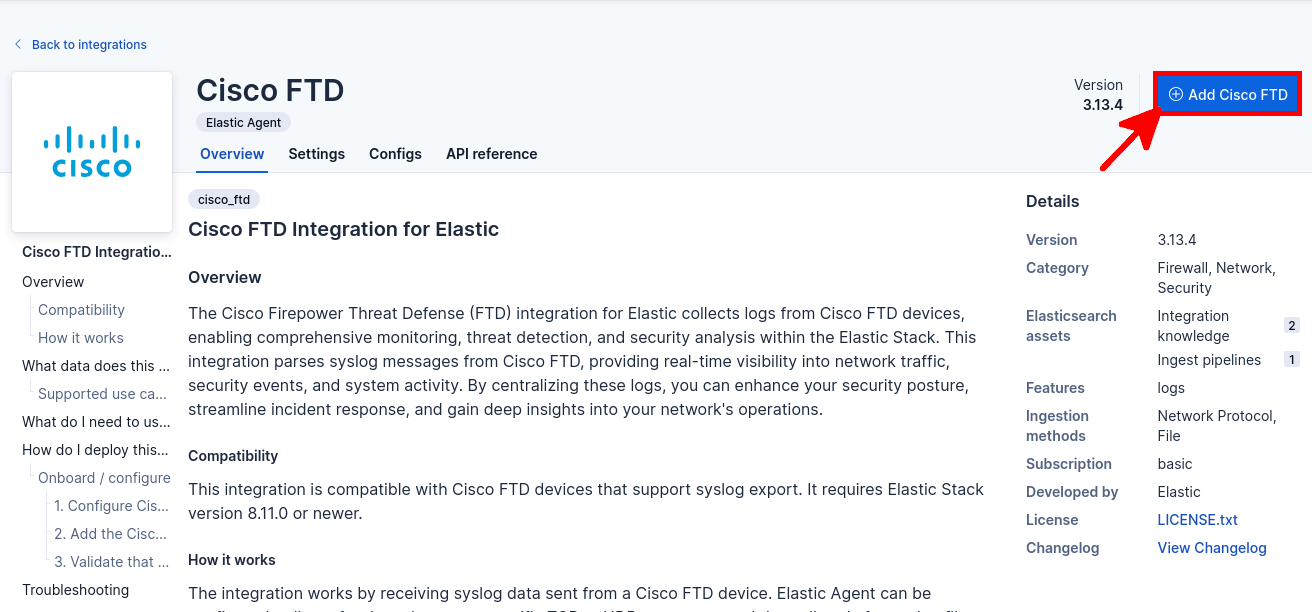
- Click the Add Cisco FTD button:
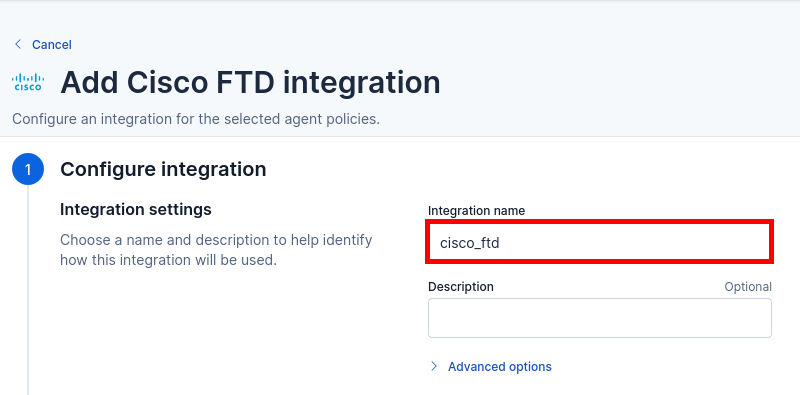
- Enter a name for the Cisco FTD integration, then scroll down:
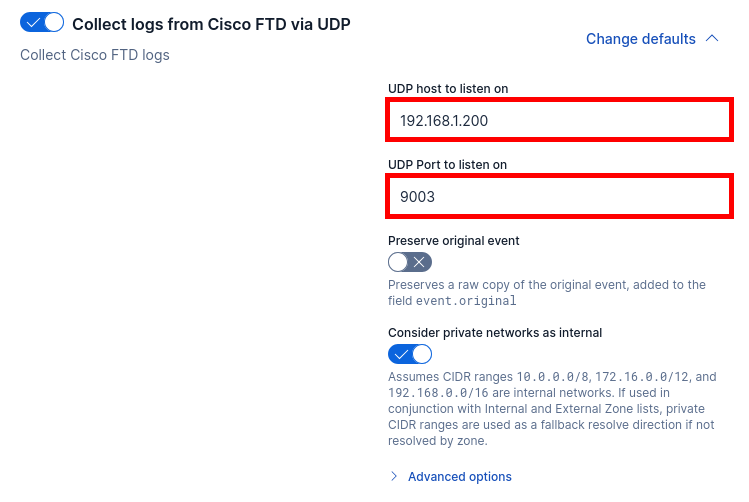
- Enter the IP address of your Elastic Agent server, then keep or change the UDP port used to receive Cisco Firepower FTD syslog logs:
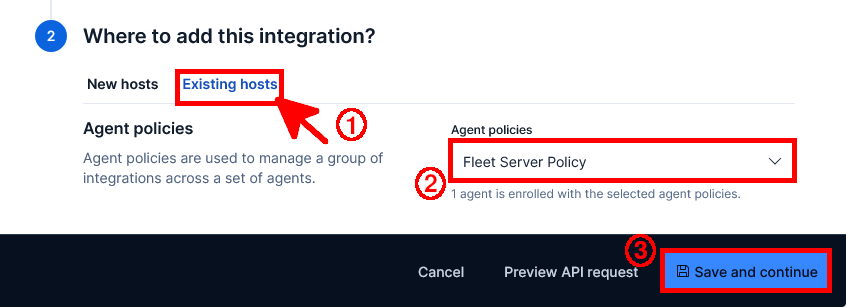
- At the bottom of the page, select the Existing hosts tab, choose the Fleet Server Policy, then click Save and continue:
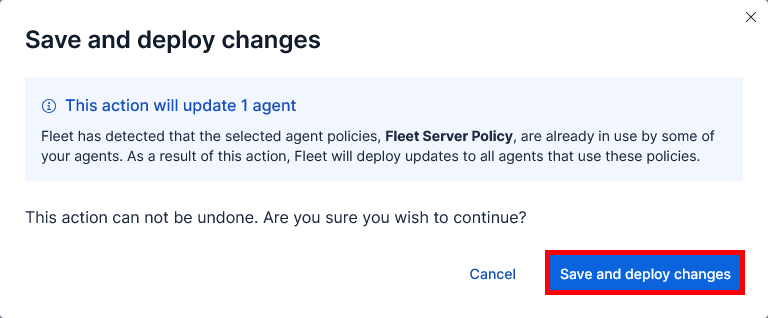
- Finally, click Save and deploy changes to apply the Cisco FTD integration to the selected Fleet policy:
- On the Elasticsearch server, check that Elastic Agent is listening on the configured Cisco FTD syslog port:
root@elk:~# ss -taun | grep 9003
udp   UNCONN    0      0                                  192.168.1.200:9003                 0.0.0.0:*
tcp   LISTEN    0      4096                               192.168.1.200:9003                 0.0.0.0:*
Configure Cisco Firepower FTD
We will now configure the Cisco Firepower FTD firewall to forward filtered traffic logs to the Elastic Agent, which is listening on 192.168.1.200 and udp/9003.
- Go to Objects > Syslog Servers, then click the Add button:

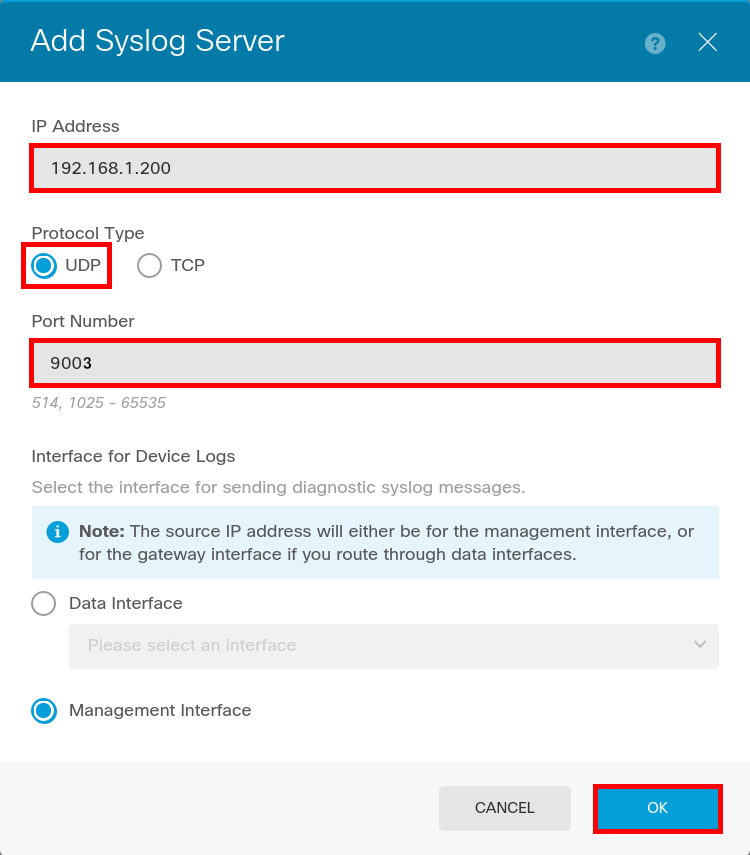
- Enter the Syslog server information, using the IP address of the Elastic Agent that will receive the Cisco FTD logs, then click OK:
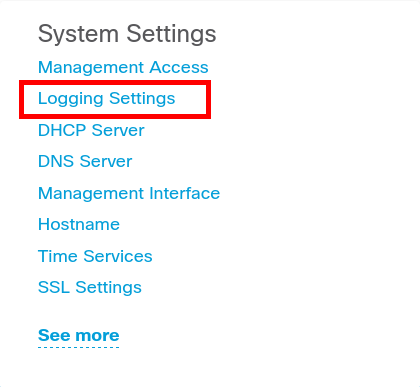
- Now that the Elastic Agent server has been declared as a Syslog server object, go to System Settings > Logging Settings:
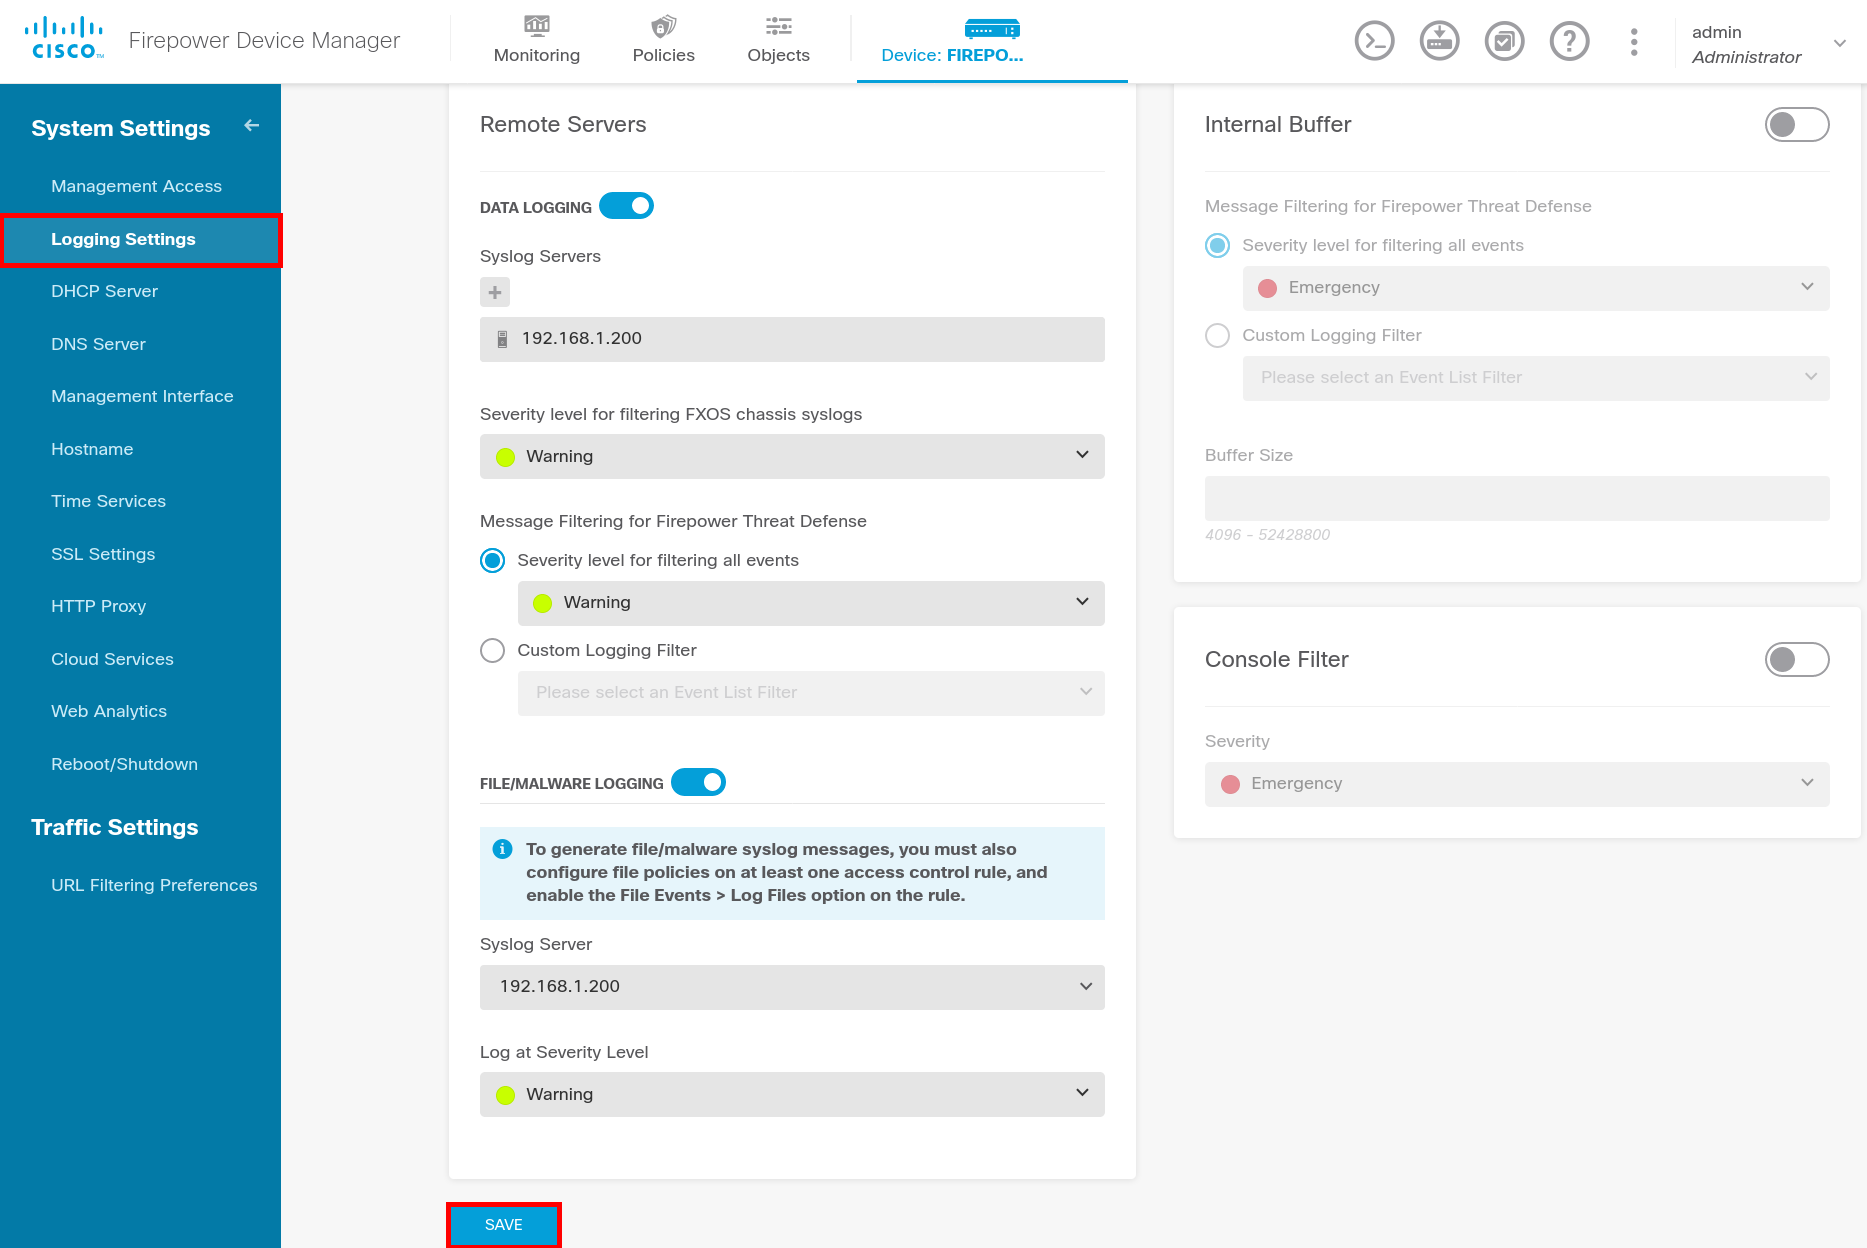
- Configure the Logging Settings as shown below, then click Save:
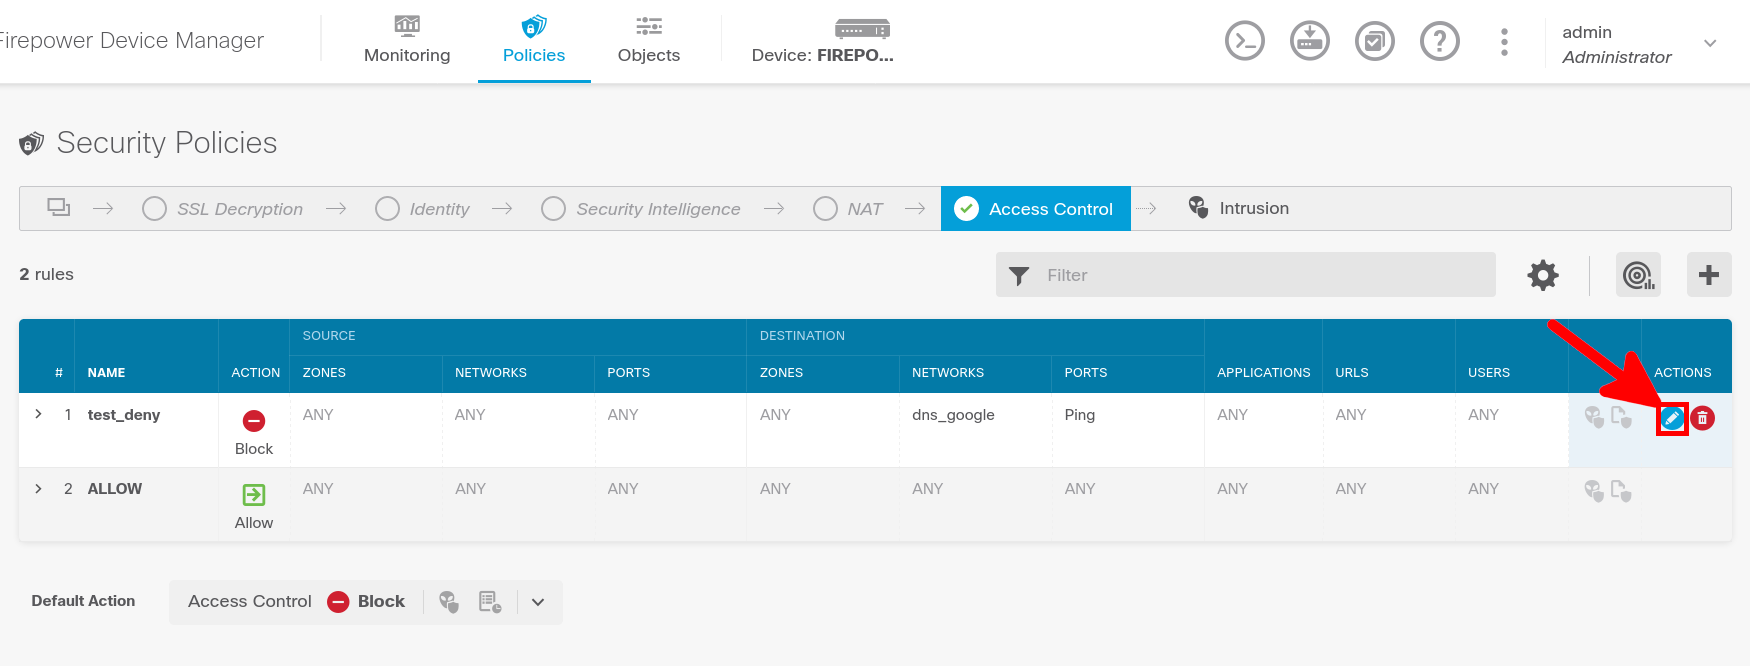
- Go to Policies, then edit the access control rule for which you want to enable traffic logging:
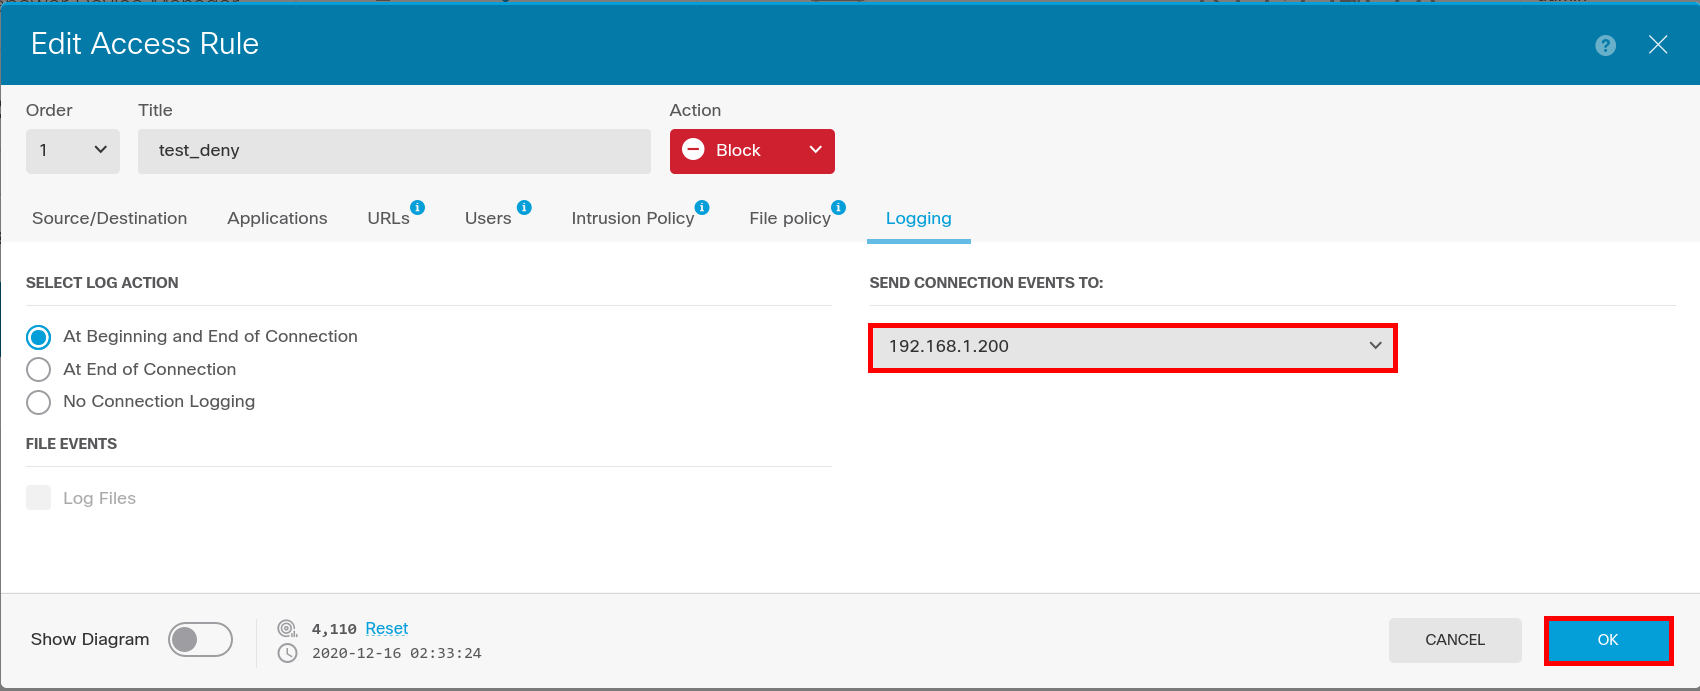
- In the Logging tab, enable connection logging, select the previously configured Syslog Server, then click OK:
Create a Kibana Dashboard for Cisco Firepower FTD
Unlike some other Elastic integrations, the Cisco FTD integration does not include a prebuilt Kibana dashboard. We will therefore create a custom dashboard to monitor Cisco Firepower FTD traffic logs.
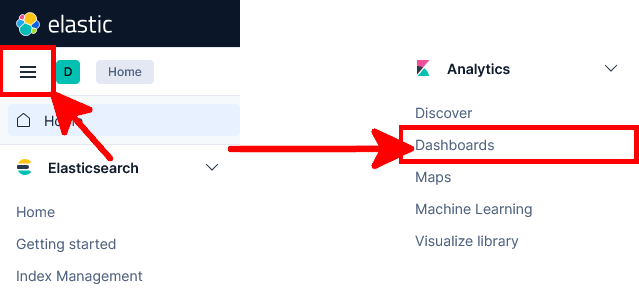
- In Kibana, open the main menu, then go to Analytics → Dashboards:
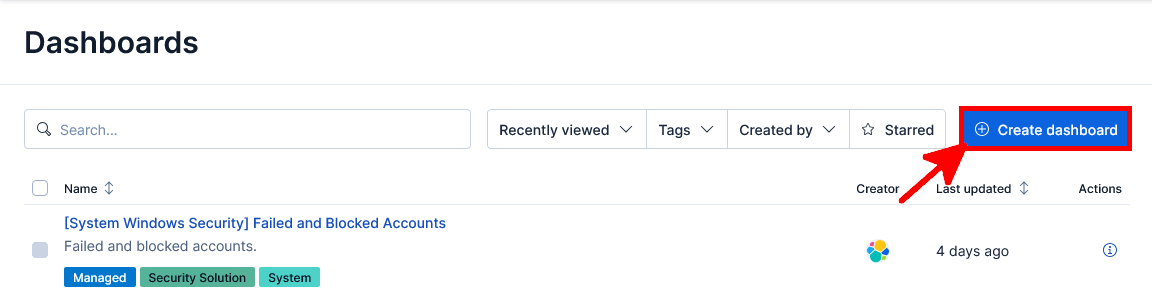
- Click Create dashboard to create a new Kibana dashboard:
Geo Map by Country
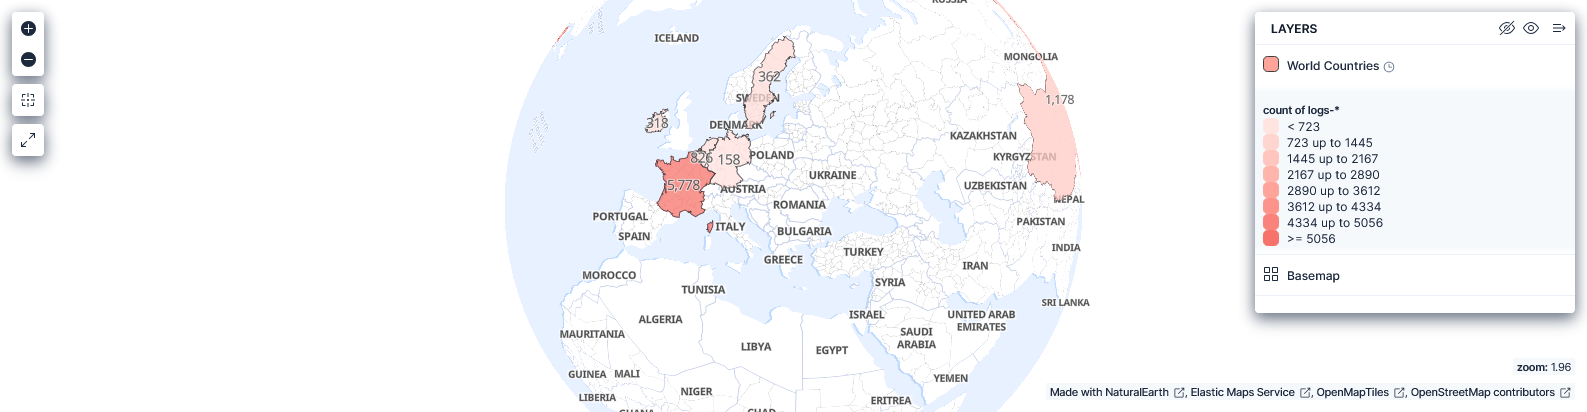
The goal is to identify the countries generating or receiving traffic through the Cisco Firepower FTD firewall.
- Expected result:
- In the new dashboard, click Create visualization to add a map panel:
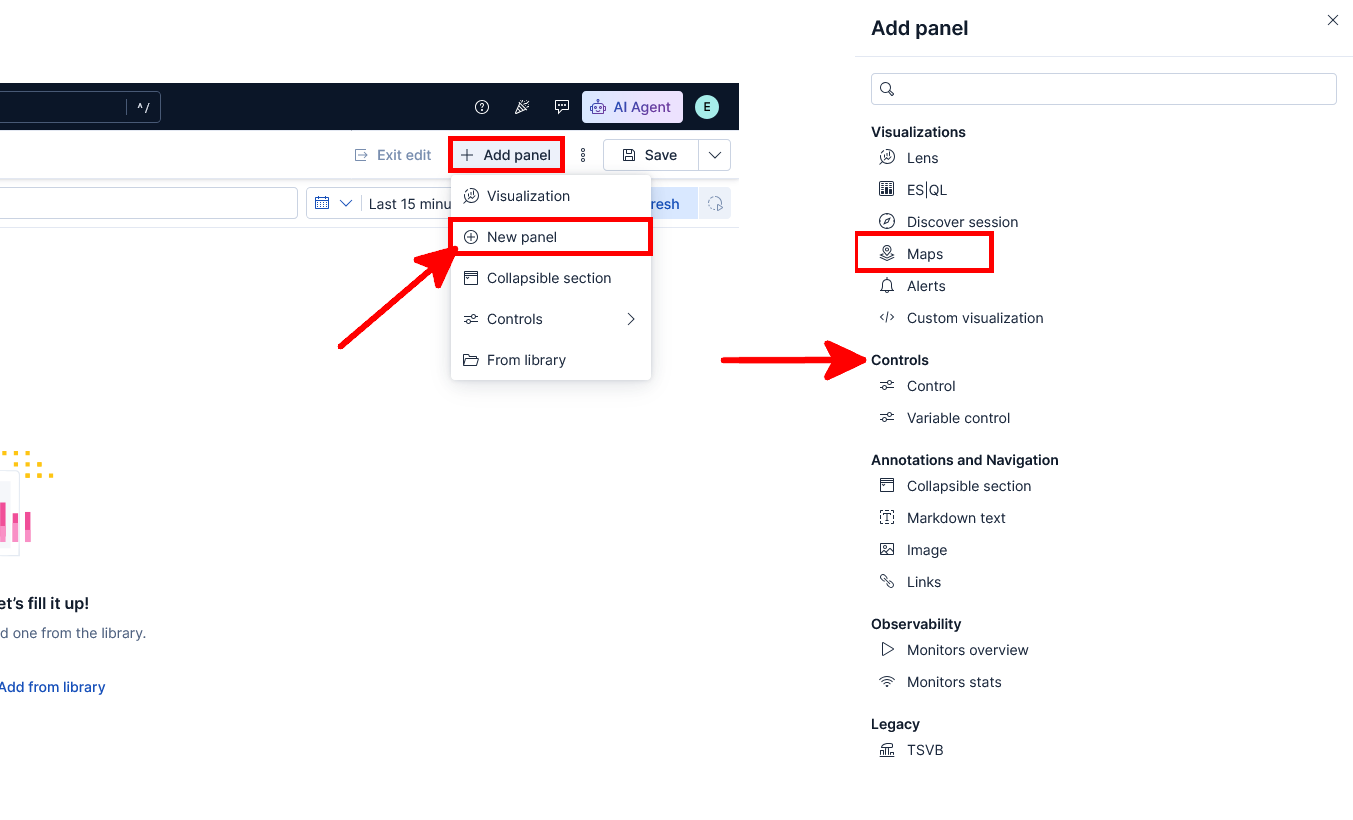
- Click Add layer, then select Choropleth:
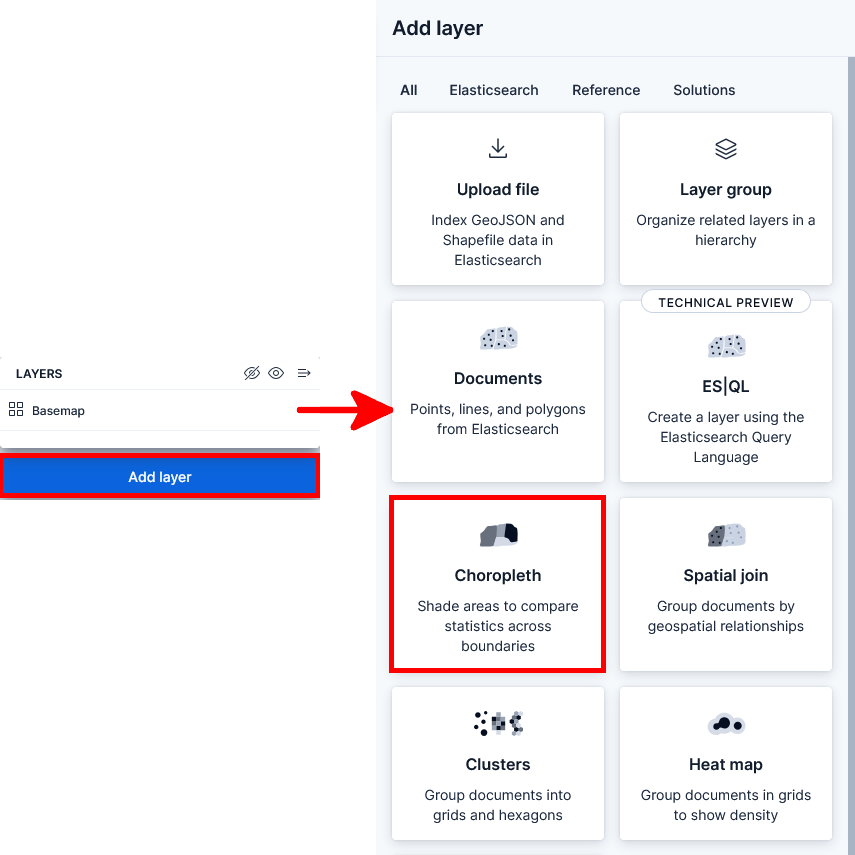
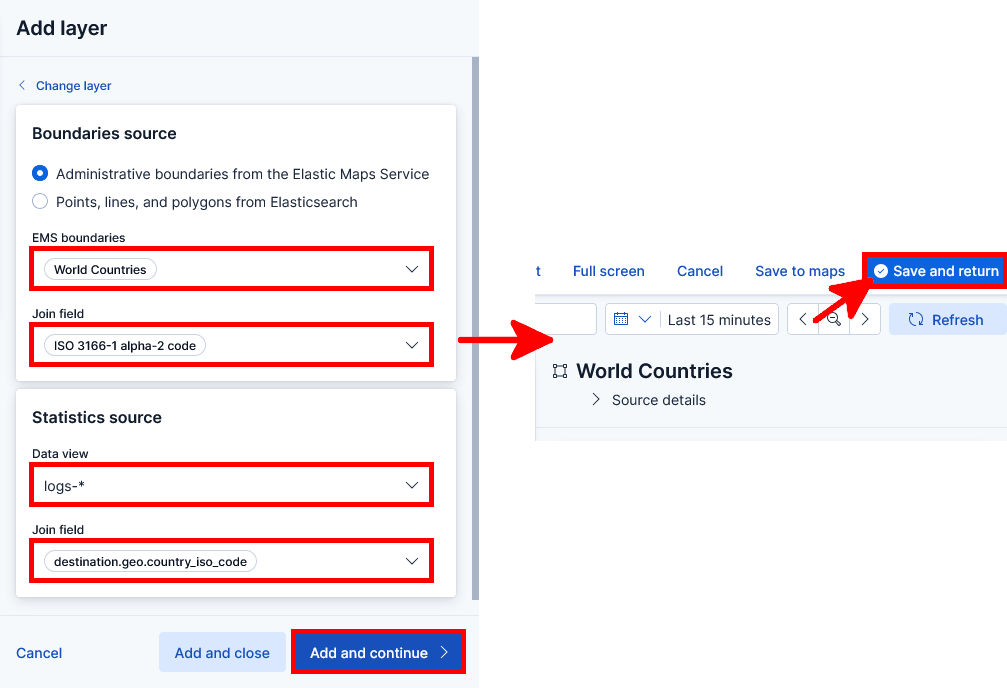
- Configure the Boundaries source and Statistics source, then click Add and continue. Once the map is displayed, click Save and return:
Blocked Traffic Gauge
The goal is to monitor blocked traffic in near real time from Cisco Firepower FTD logs.
- Expected result:

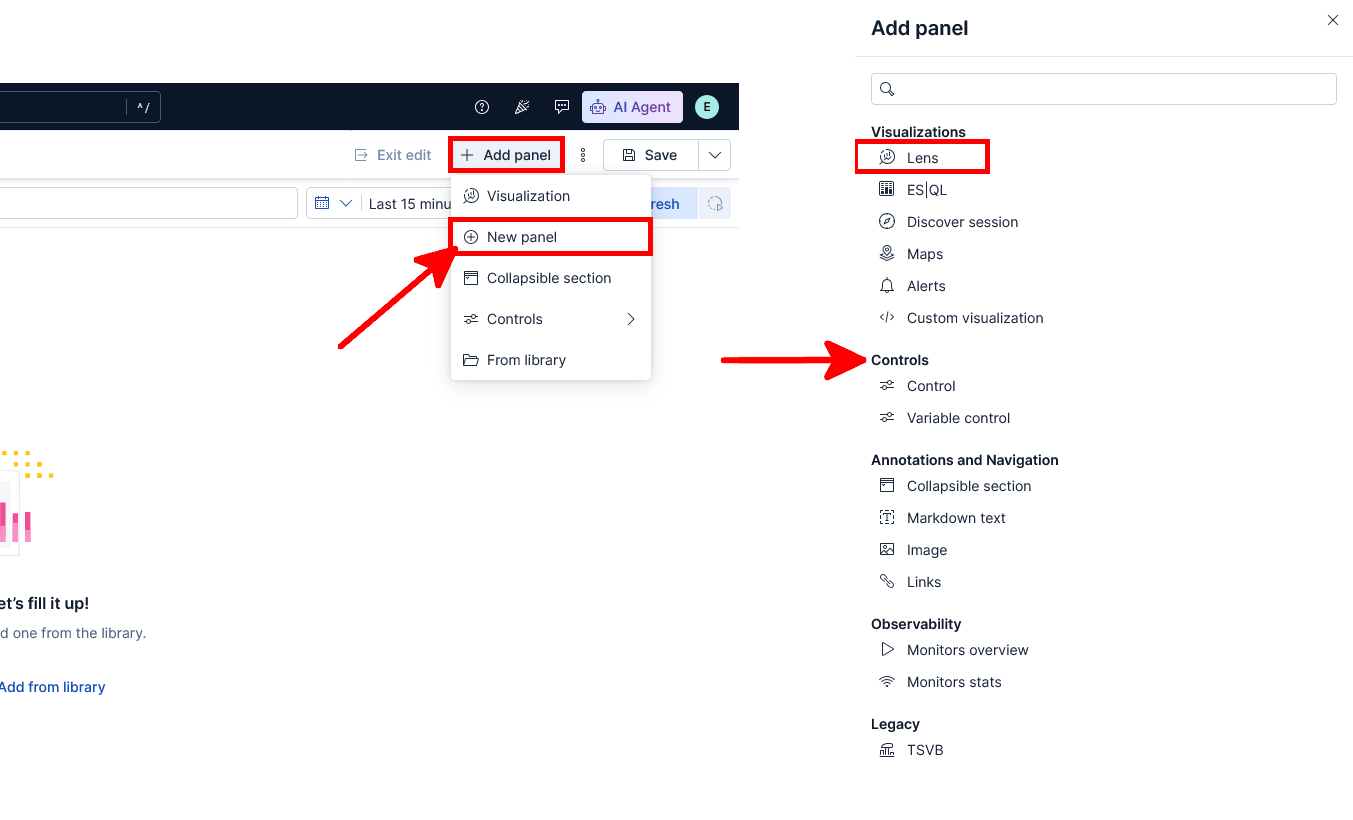
- Click Add panel, select New panel, then choose Lens:
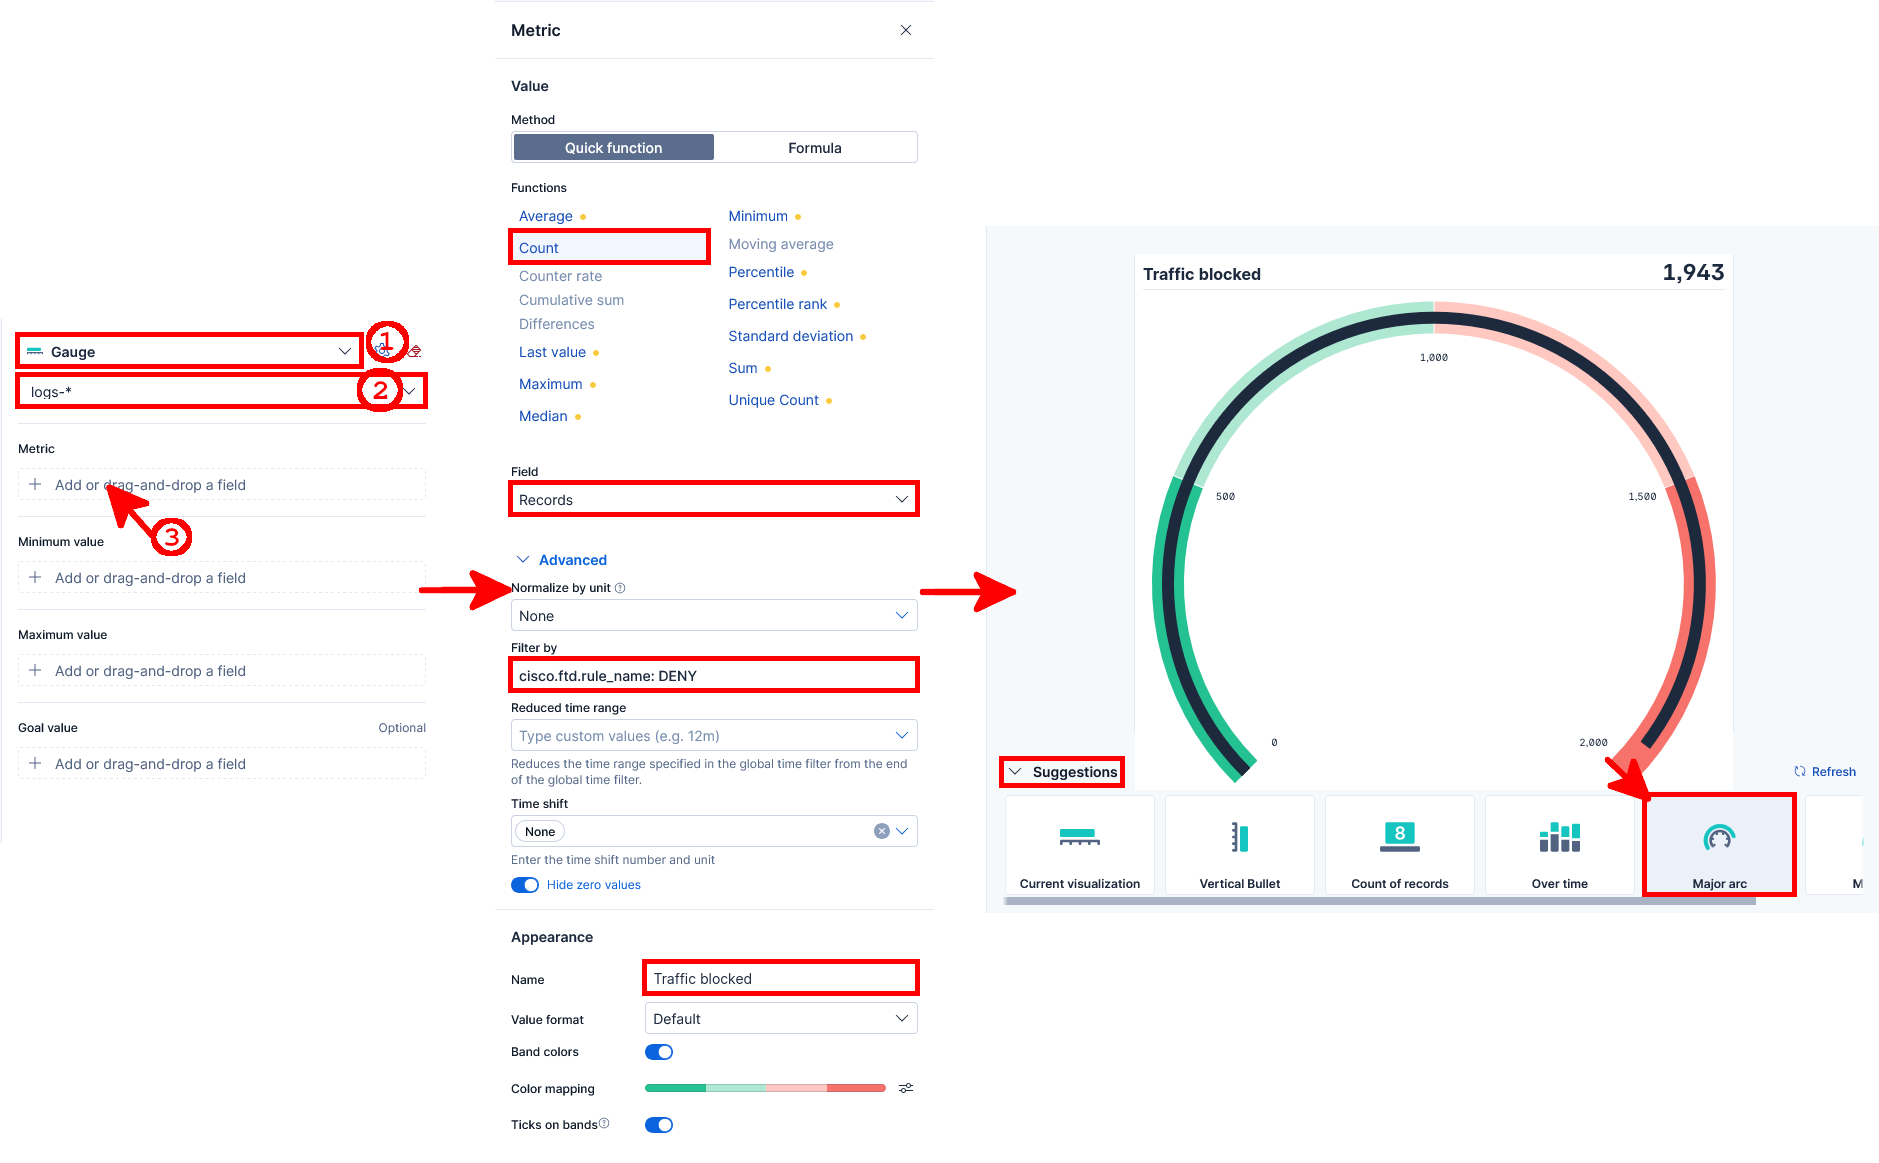
- Select Gauge, choose the
logs-*data view, then configure the Metric field:
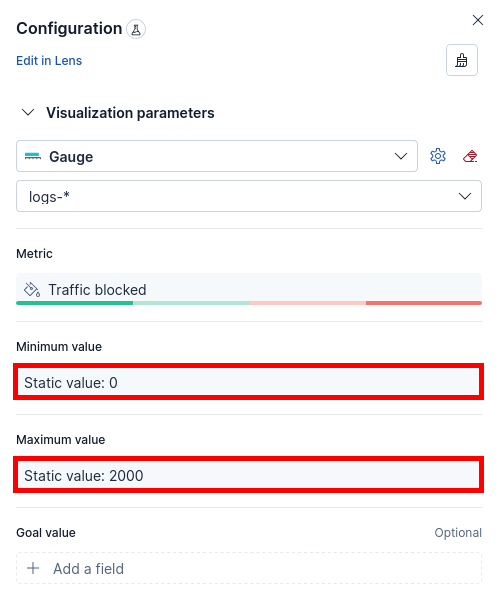
- Adjust the Minimum value and Maximum value according to the usual amount of blocked traffic on your network:
Top Source Ports by Protocol
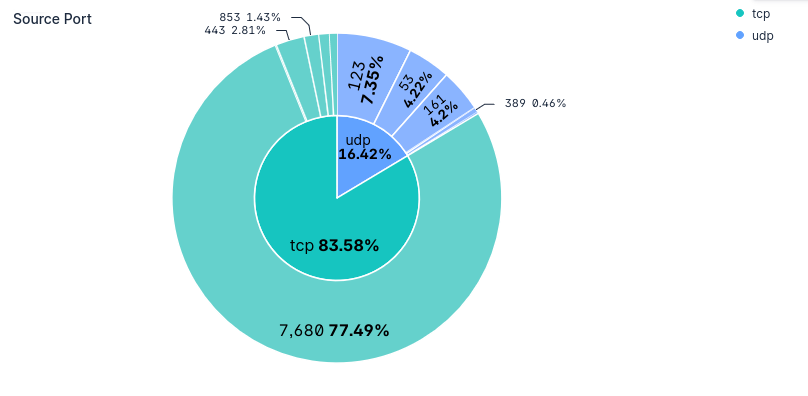
The goal is to identify the most frequently used source ports in Cisco Firepower FTD traffic logs.
- Expected result:
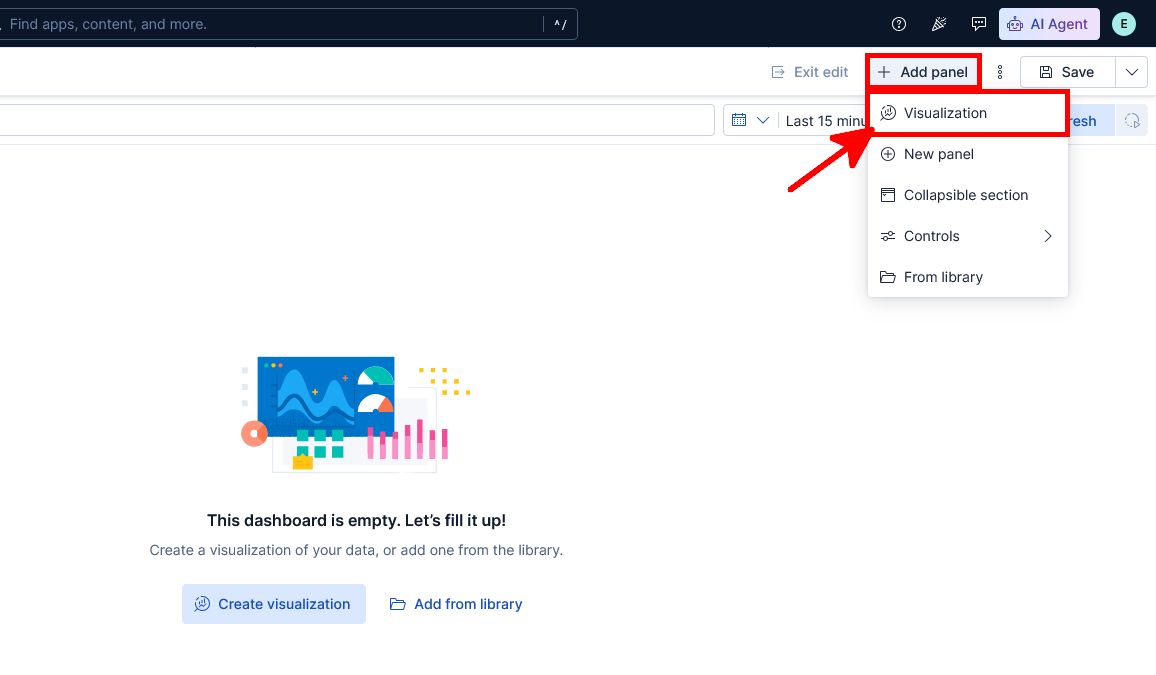
- Click Add panel, then select Visualization:
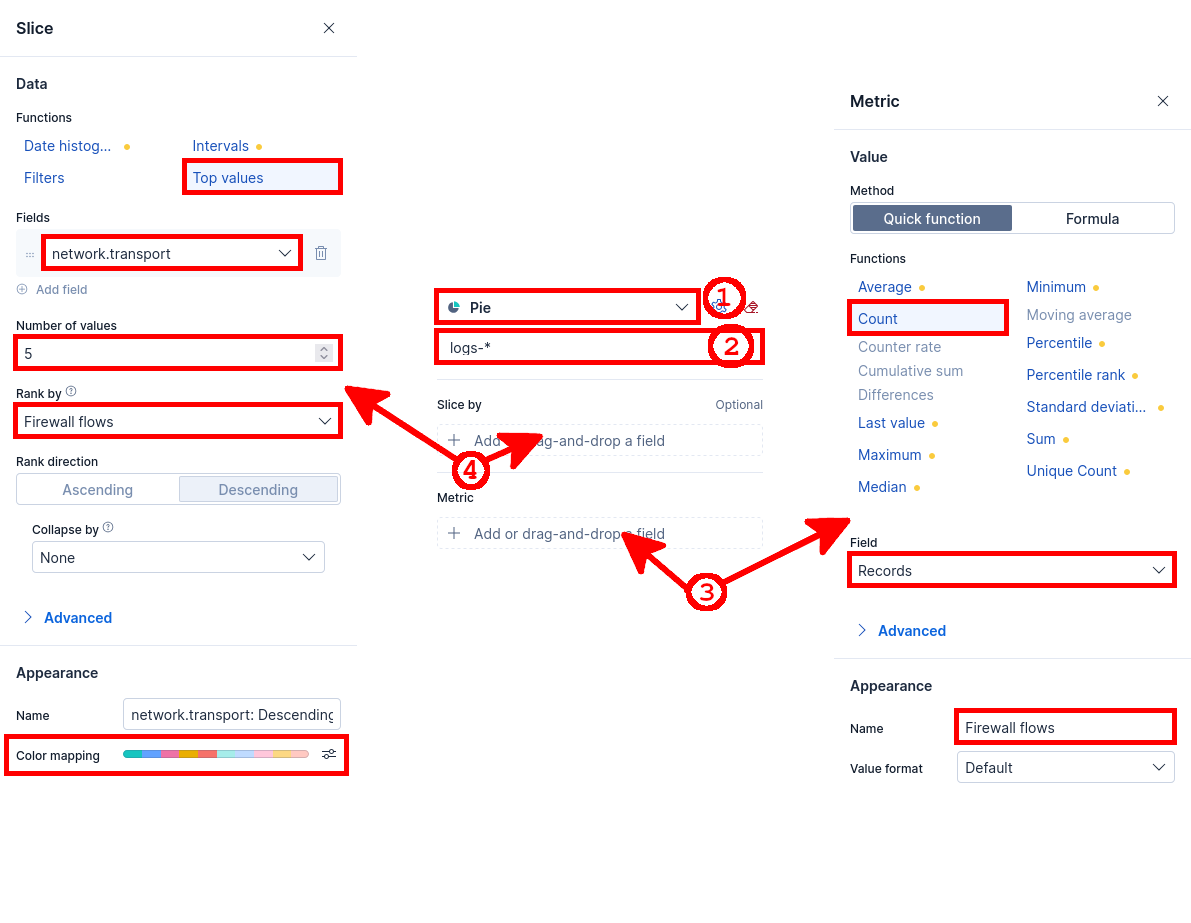
- Configure the Pie visualization by using
network.transportas the slice field and Records as the metric:
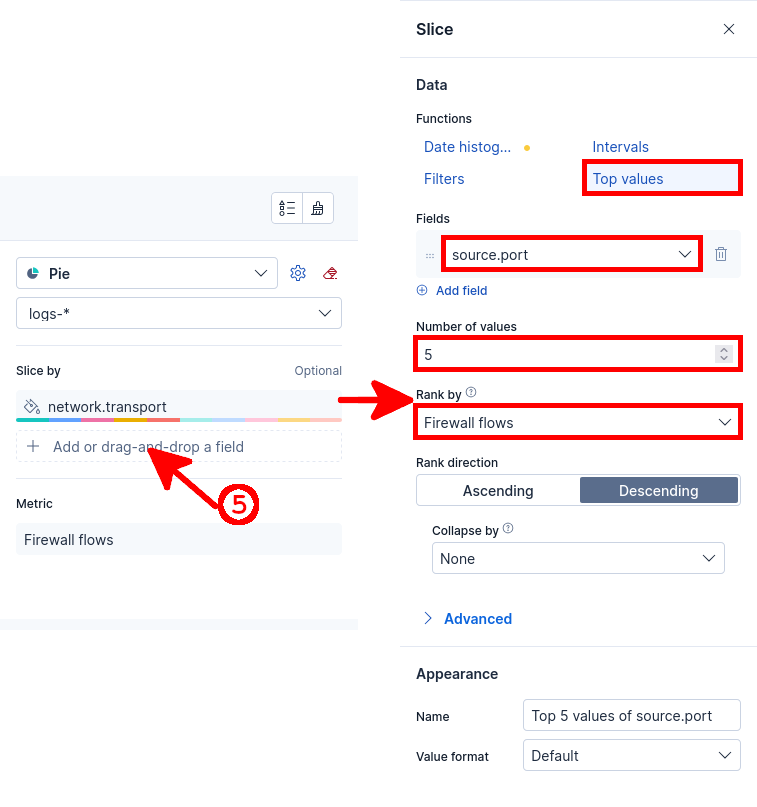
- Add a second slice field, then select
source.portand rank the top values by Firewall flows:
Top Destination Ports
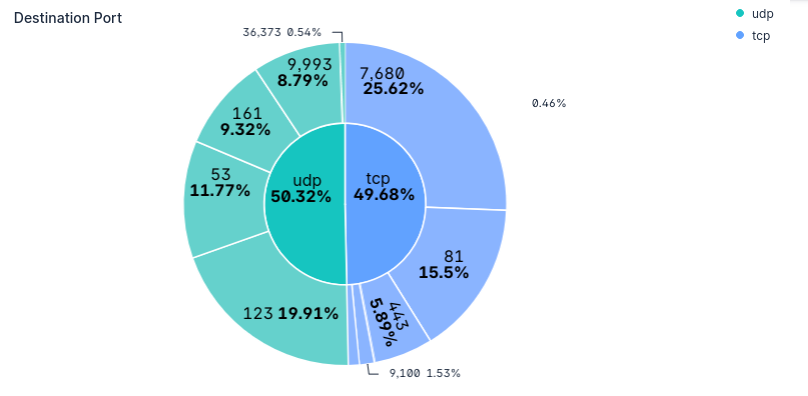
The goal is to identify the most frequently used destination ports in Cisco Firepower FTD traffic logs.
- Expected result:
- Click Add panel, then select Visualization:
- Configure the Pie visualization by using
network.transportas the slice field and Records as the metric:
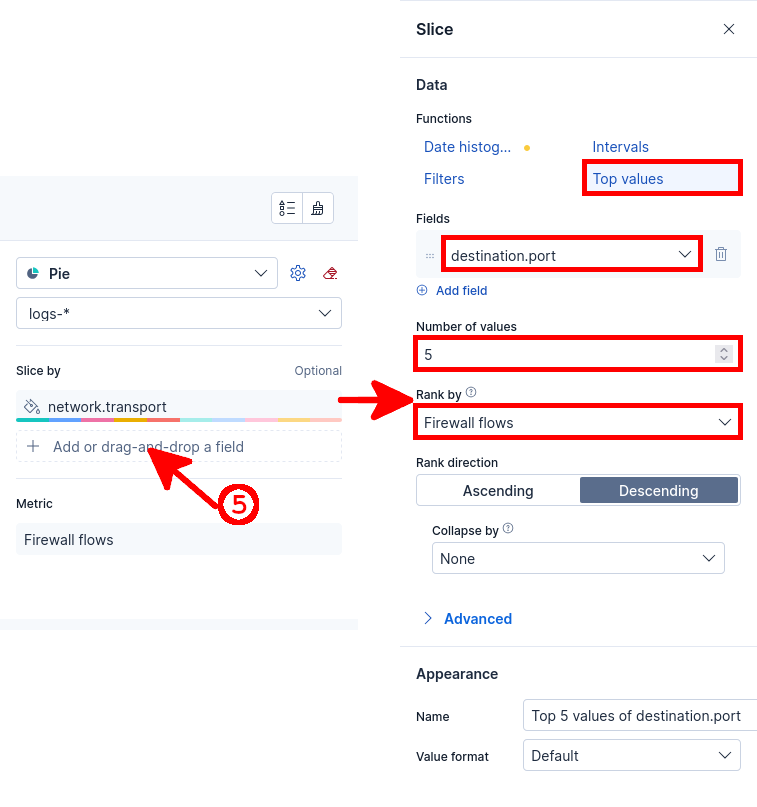
- Add a second slice field, then select
destination.portand rank the top values by Firewall flows:
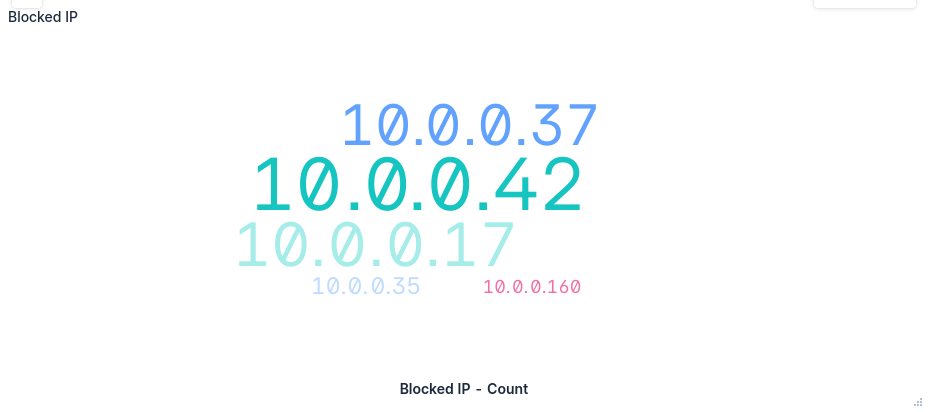
Top Blocked IP Addresses
The goal is to identify the IP addresses most frequently blocked by the Cisco Firepower FTD firewall.
- Expected result:
- Click Add panel, then select Visualization:
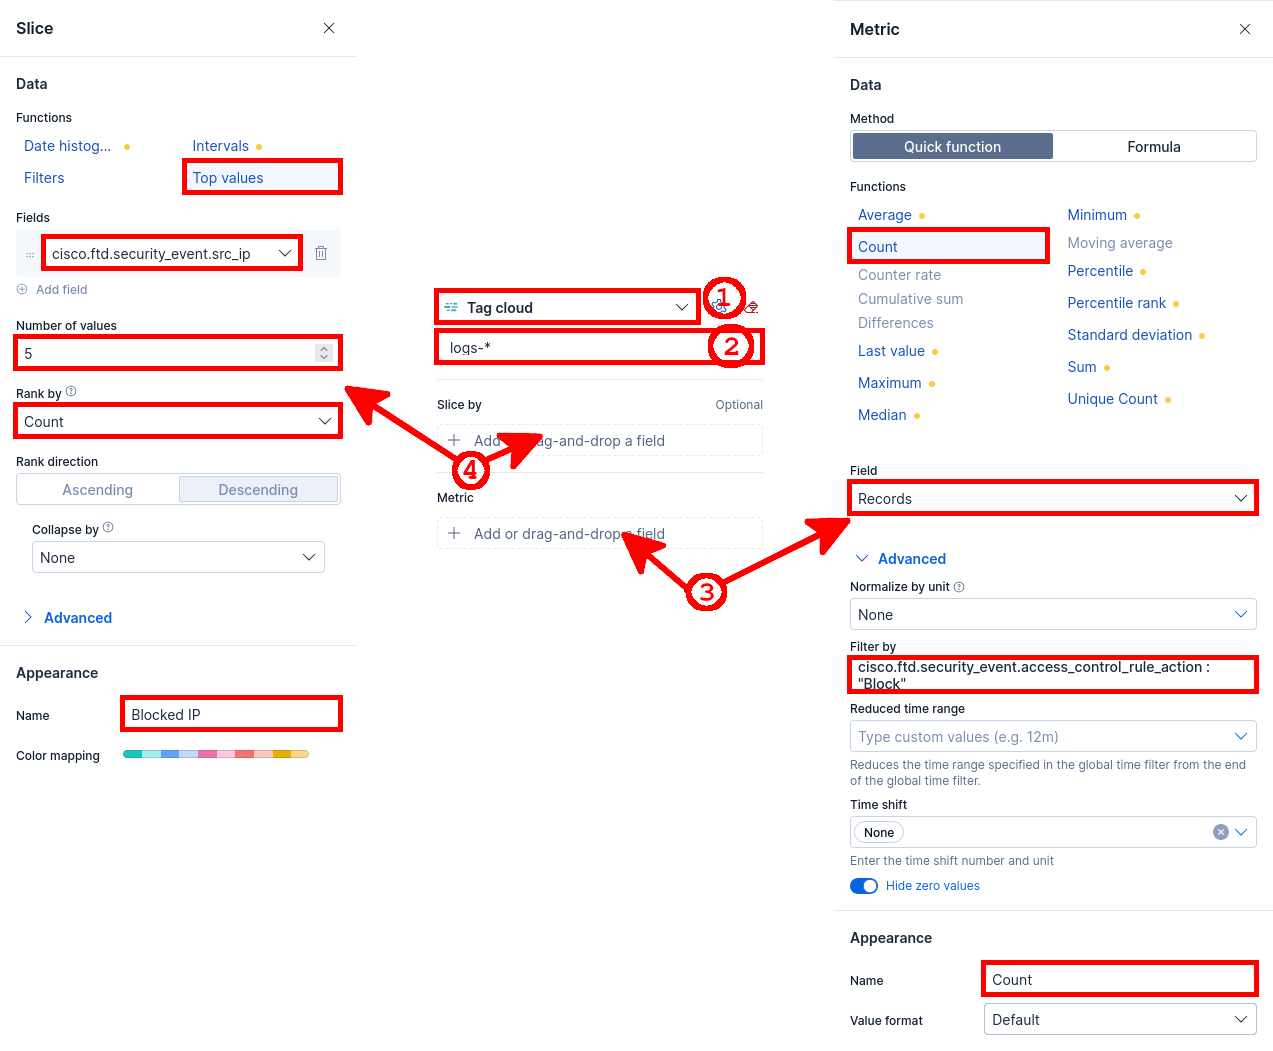
- Configure the Tag cloud visualization by using
cisco.ftd.security_event.src_ipas the field and a Count metric filtered on blocked traffic:
Top Blocking Rules
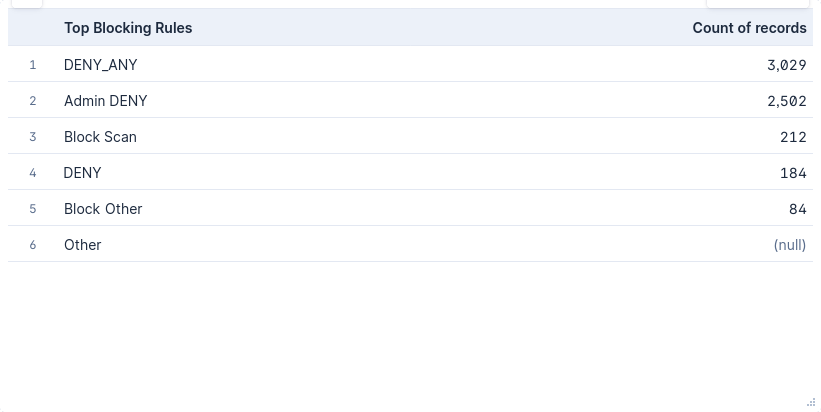
The goal is to identify the blocked access control rules that match the most Cisco Firepower FTD traffic.
- Expected result:
- Click Add panel, then select Visualization:
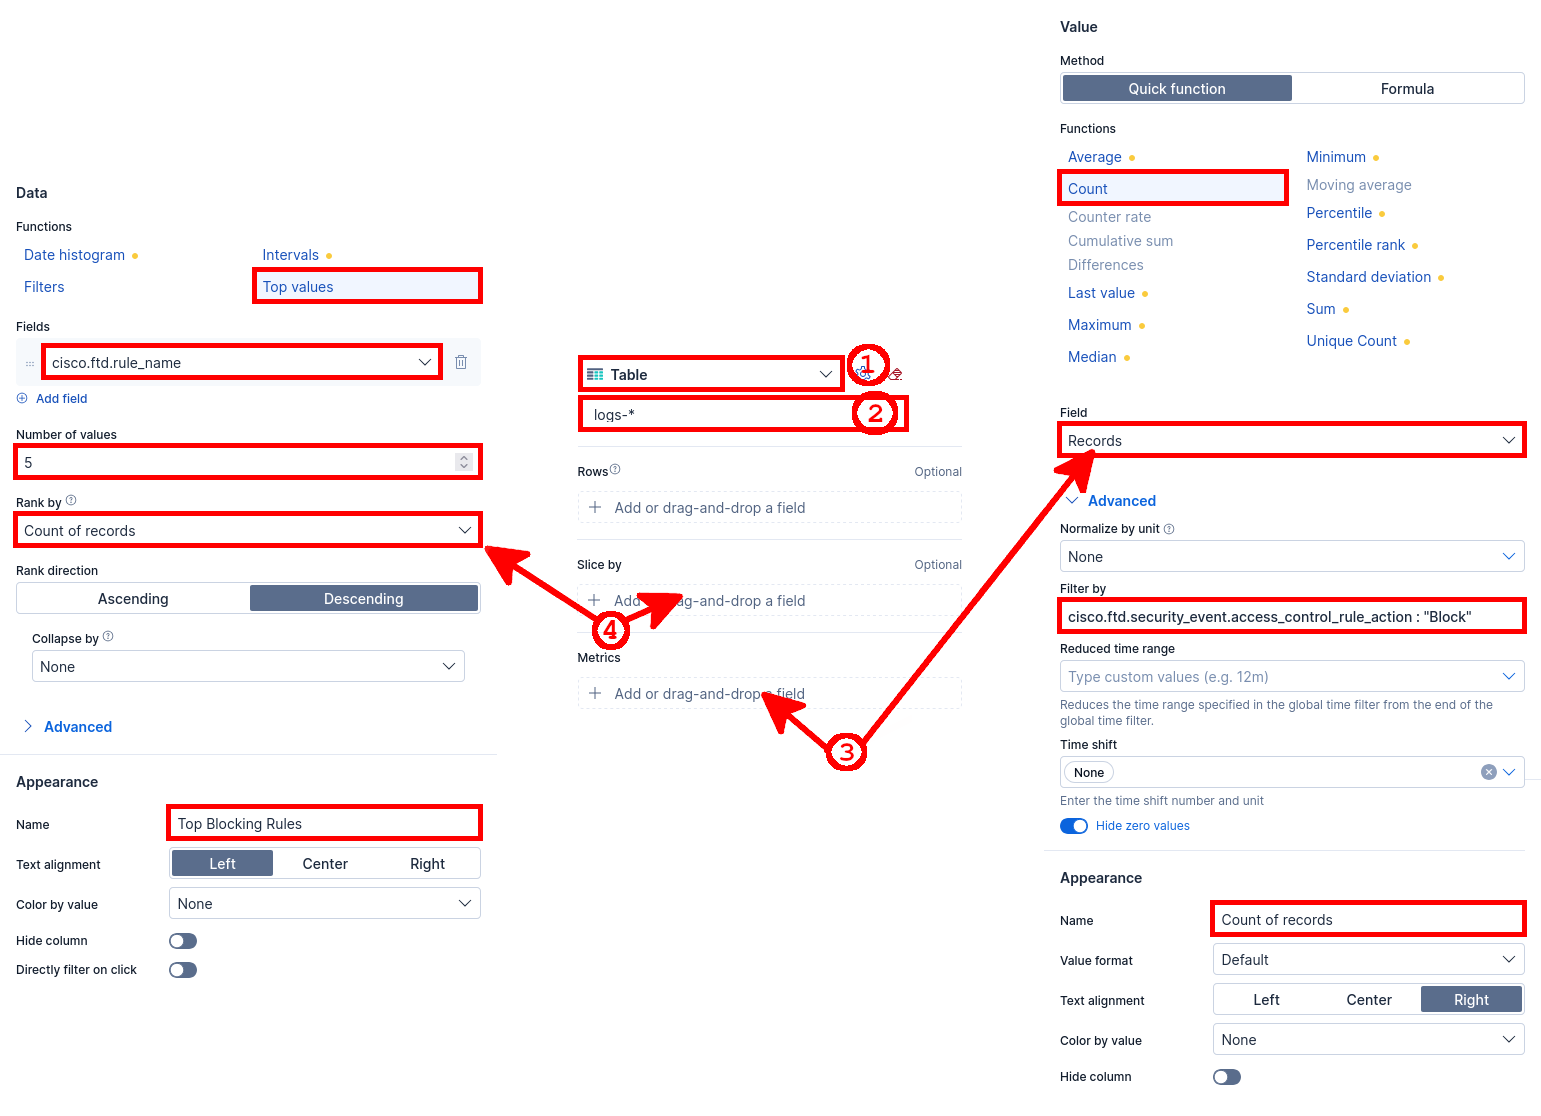
- Configure the Table visualization by using
cisco.ftd.rule_nameas the row field and a Count of records metric filtered on blocked traffic:
Conclusion
You now have a basic but useful Kibana dashboard to monitor Cisco Firepower FTD logs with Elastic Fleet and Elastic Agent. From here, you can extend the dashboard with additional filters, alerts, and visualizations based on your own firewall rules and network traffic patterns. Now it's your turn!